When Business Intelligence adapts to every user

Traditional BI forces everyone to use the same dashboards. This creates friction because a CEO, sales manager, and finance team all need different things from the same data. Adaptive BI adapts to how each role naturally explores data and asks questions.
What we will cover
- What is Adaptive Business Intelligence?
- What it really means for BI to "adapt" to the user
- From BI dashboards to Exploratory Data Analysis
- Key capabilities of adaptive BI platforms
- How different roles explore data differently
- Why adaptive BI improves decision-making
What it Adaptive Business Intelligence?
Open almost any BI tool today and you'll see the same thing: the same dashboards, the same charts, the same KPIs — for everyone.
At first glance, this seems efficient. In reality, it creates friction.
A CEO looks for direction.
A sales manager looks for movement.
A finance team looks for explanations.
Yet they're all expected to navigate the same screens and interpret the same metrics.
The result?
- Important signals get buried
- Non-technical users feel lost
- Decisions slow down instead of speeding up
Instead of helping people think, BI tools often demand that people learn the tool first.
Adaptive Business Intelligence flips this logic.
Rather than forcing users to adapt to dashboards, BI should adapt to how people naturally think, ask questions, and explore data.
In this article, we look at how BI can truly adapt to every user — by supporting exploratory data analysis, conversational interactions, visual exploration, and shared insights — making data easier to understand and more useful for everyday decisions, even for non-technical users.
What it really means for BI to "adapt" to the user
When people hear "adaptive BI," they often think of:
- Custom dashboards
- Saved views
- Role-based filters
But these still put the burden on the user.
The user must configure, adjust, and manage the experience before getting any value.
Adaptive BI means something deeper.
It adapts to how people explore data, not just what they see. Every interaction with data begins the same way: with a question.
- Why did sales change this month?
- Where is performance slowing down?
- Are we still on track?
Different roles ask different questions, but the process is universal.
Traditional BI ignores this. It forces everyone through predefined dashboards and rigid paths, regardless of intent.
Adaptive BI does the opposite.
It allows users to:
- Start with a question
- Explore data step by step
- Refine their understanding as new insights appear
When BI adapts to the user:
- Exploration feels intuitive, not forced
- Users are guided instead of overwhelmed
- Insights emerge naturally, not through trial and error
This shifts BI away from static reporting and toward human-centred exploration.
Instead of learning how the tool works, users focus on what the data is telling them — making BI more approachable, more engaging, and far more valuable across the organisation.
From BI Dashbaords to Exploratory Data Analysis
For many teams, Business Intelligence still means opening a fixed report and checking a predefined set of numbers. These reports usually answer a single question, such as "What were sales last month?" — but they rarely help users understand why something changed or what to look at next.
This is where Exploratory Data Analysis changes the experience.
Instead of consuming static reports, users explore data step by step, following their natural curiosity.
What Exploratory Data Analysis Looks Like in Practice
Exploratory analysis mirrors how people think when making decisions:
- Start with a high-level result
- Notice a change, spike, or drop
- Ask a follow-up question
- Compare segments, periods, or regions
- Refine understanding until the picture is clear
This process does not require technical skills. It requires the ability to ask questions and explore.
Static Reporting vs Exploratory Data Analysis
| Traditional BI Reports | Exploratory Data Analysis |
|---|---|
| Fixed questions | Open-ended questions |
| Predefined dashboards | Flexible exploration |
| One answer per report | Multiple follow-up insights |
| Heavy reliance on analysts | Self-service for business users |
| Used occasionally | Used daily |
Why Exploratory Data Analysis matters
Exploratory analysis removes many of the barriers that traditionally keep BI in the hands of specialists.
For example:
- A sales manager can compare regions without requesting a new report
- A marketing lead can explore campaign performance over time
- A finance team can investigate variances as soon as they appear
Instead of waiting for answers, users find them themselves. When BI supports exploration, it stops being a passive reporting tool and becomes part of everyday decision-making.
- Users engage with data instead of just reading it
- Insights are discovered, not delivered late
- Confidence increases because understanding is built step by step
This shift lays the foundation for more advanced capabilities, such as conversational analysis and adaptive visualisation, which make exploration even easier for non-technical users.
Key capabilities of adaptive BI platforms
Adaptive BI platforms share several core capabilities that make data exploration intuitive, flexible, and accessible across different roles.
Creating dashboards through natural language
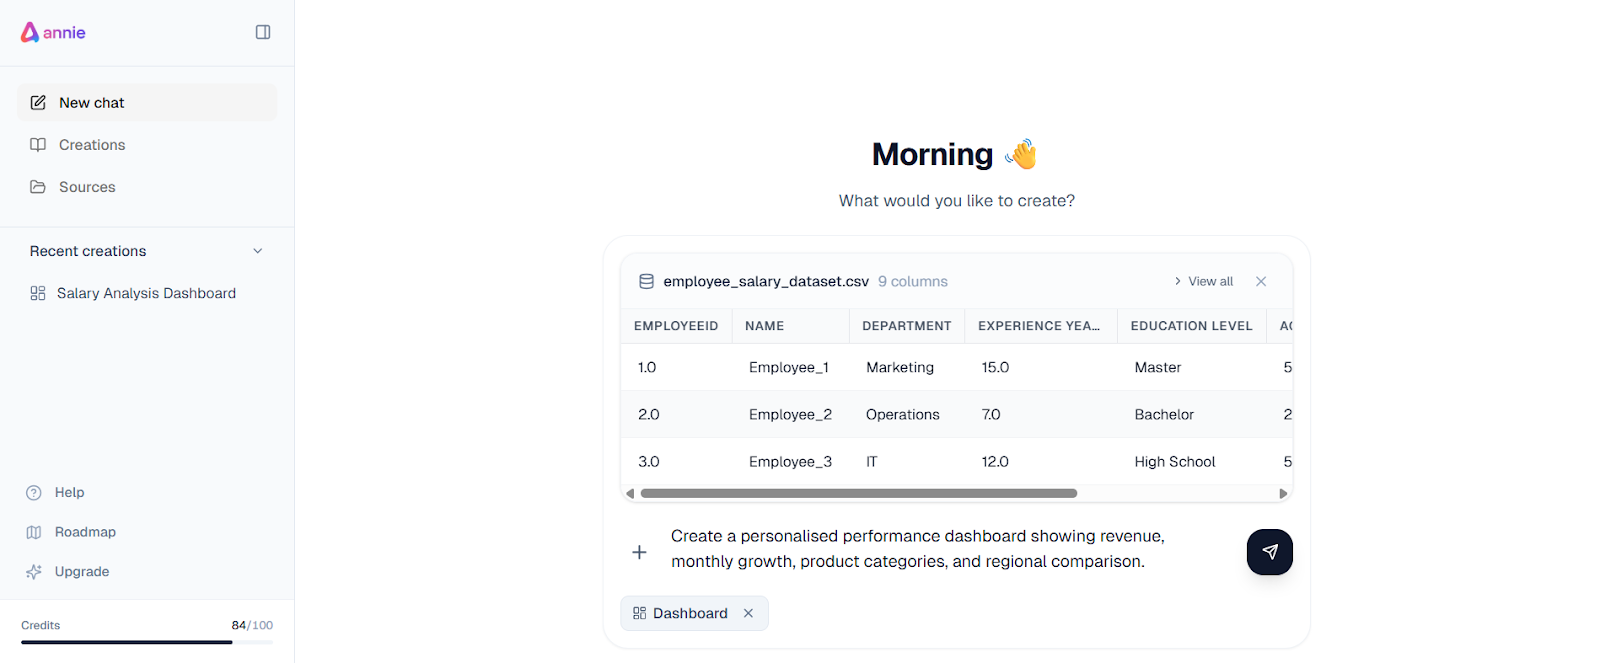
Traditional BI forces users to configure dashboards manually before they can explore data. This creates friction—users must decide which charts to build, which metrics to include, and how to structure everything upfront.
Natural-language BI removes this barrier. Users describe what they want in plain business terms, and the system generates the dashboard structure automatically.
For example: "Create a performance dashboard showing revenue, monthly growth, product categories, and regional comparison."
This enables users to:
- Move directly from intent to visual analysis
- Start from a meaningful structure instead of a blank screen
- Focus on exploration rather than setup
| Traditional BI | Natural-Language BI |
|---|---|
| Manual dashboard setup | Dashboard created from description |
| Requires BI tool familiarity | Uses everyday business language |
| Slower time to first insight | Faster access to visual analysis |
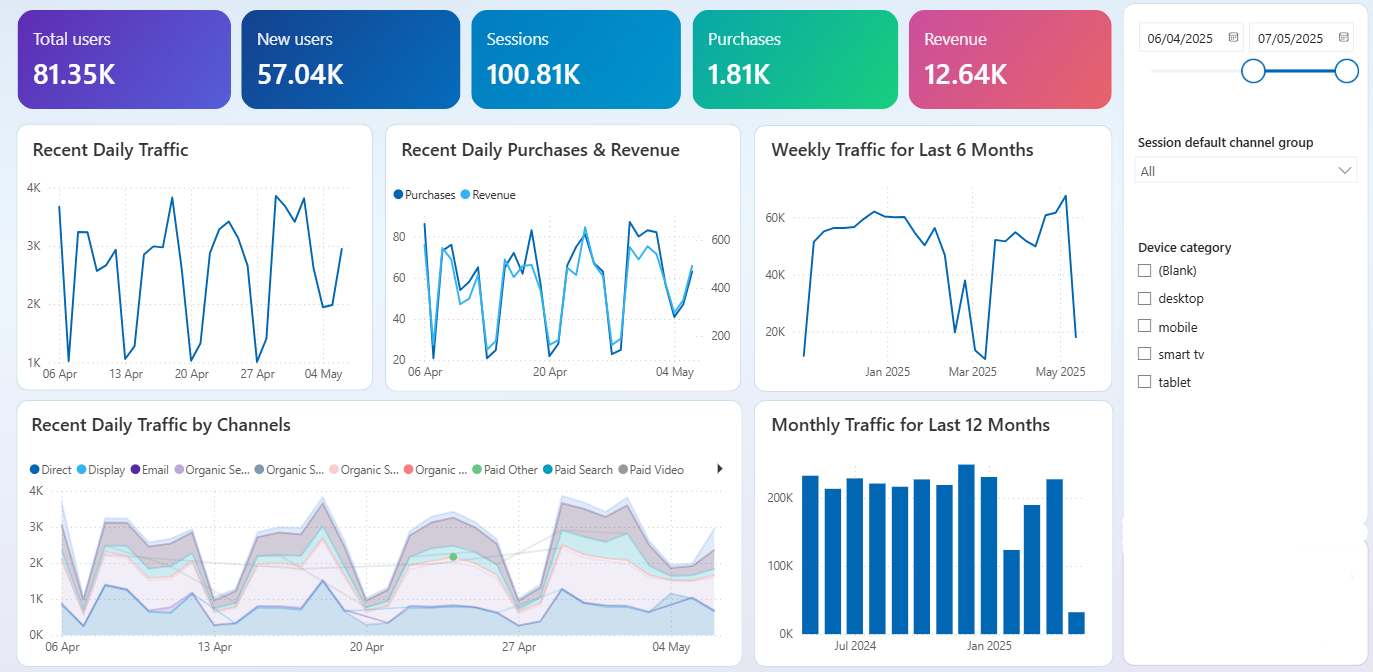
Turning questions into clear visuals
Understanding data requires seeing it clearly. Instead of manually configuring charts, users generate and adjust visuals naturally based on their questions.
Well-chosen charts help users:
- Spot trends and patterns quickly
- Compare performance across segments
- Identify anomalies or unexpected changes
Users might start with a trend view, switch to a regional comparison, zoom into a specific period, or change chart types—all without technical setup.
| Chart Type | What It Reveals |
|---|---|
| Line charts | Trends over time |
| Bar charts | Comparisons between categories |
| Tables | Detailed values and breakdowns |
As users explore visuals, understanding develops progressively. A chart reveals a spike, the user asks why, a new visual adds context, and the insight becomes clearer with each step.
Supporting continuous exploration
Data analysis is rarely one-step. Insights emerge gradually as users refine their questions and adjust their focus.
The typical exploration loop:
- Start with an initial question
- Adjust time range, segment, or metric
- Add context through comparisons
- Narrow focus to what matters
- Confirm or challenge assumptions
Traditional BI forces users to rebuild reports for each refinement. Adaptive BI lets users edit views, continue from where they left off, and build understanding incrementally—keeping them engaged rather than interrupted.
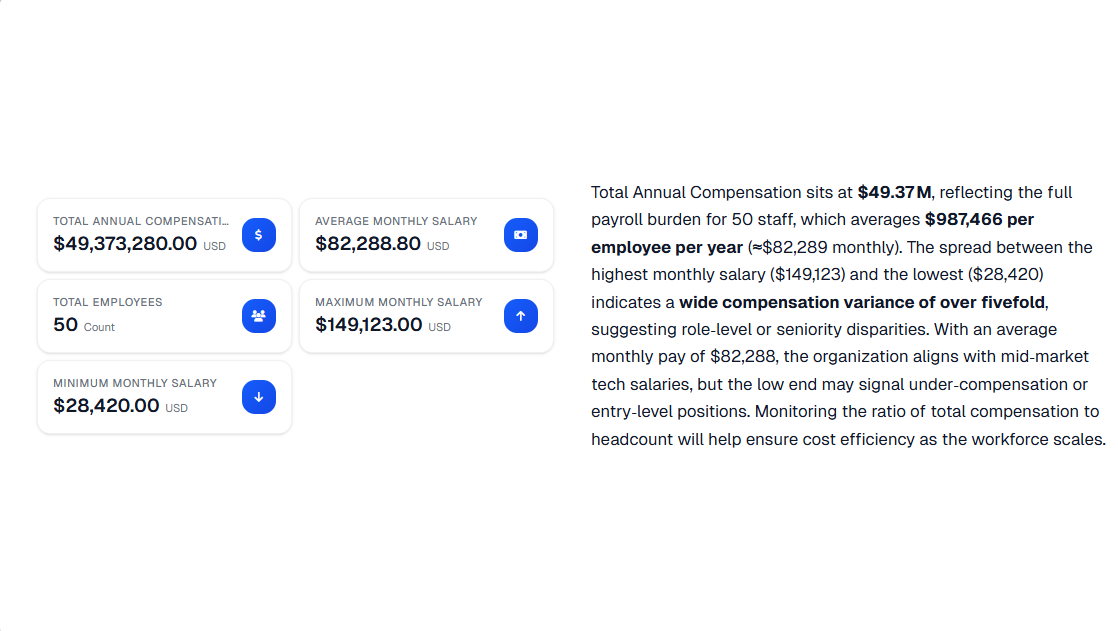
Sharing insights through dashboards and narratives
Analysis only creates value when insights can be shared effectively.
Dashboards become the result of exploration, not the starting point. They act as concise summaries that align teams around key findings without forcing others to repeat the exploration process.
Data narratives add essential context by explaining what changed, why it matters, and what to consider next. Combining visuals with explanations helps others understand the meaning behind the data, not just the figures.
When sharing is simple:
- Insights move faster across teams
- Meetings focus on decisions, not explanations
- Individual discoveries become team knowledge
- Context is preserved when insights are shared
This transforms BI from a personal analysis tool into a collaborative decision platform.
How different roles explore data differently
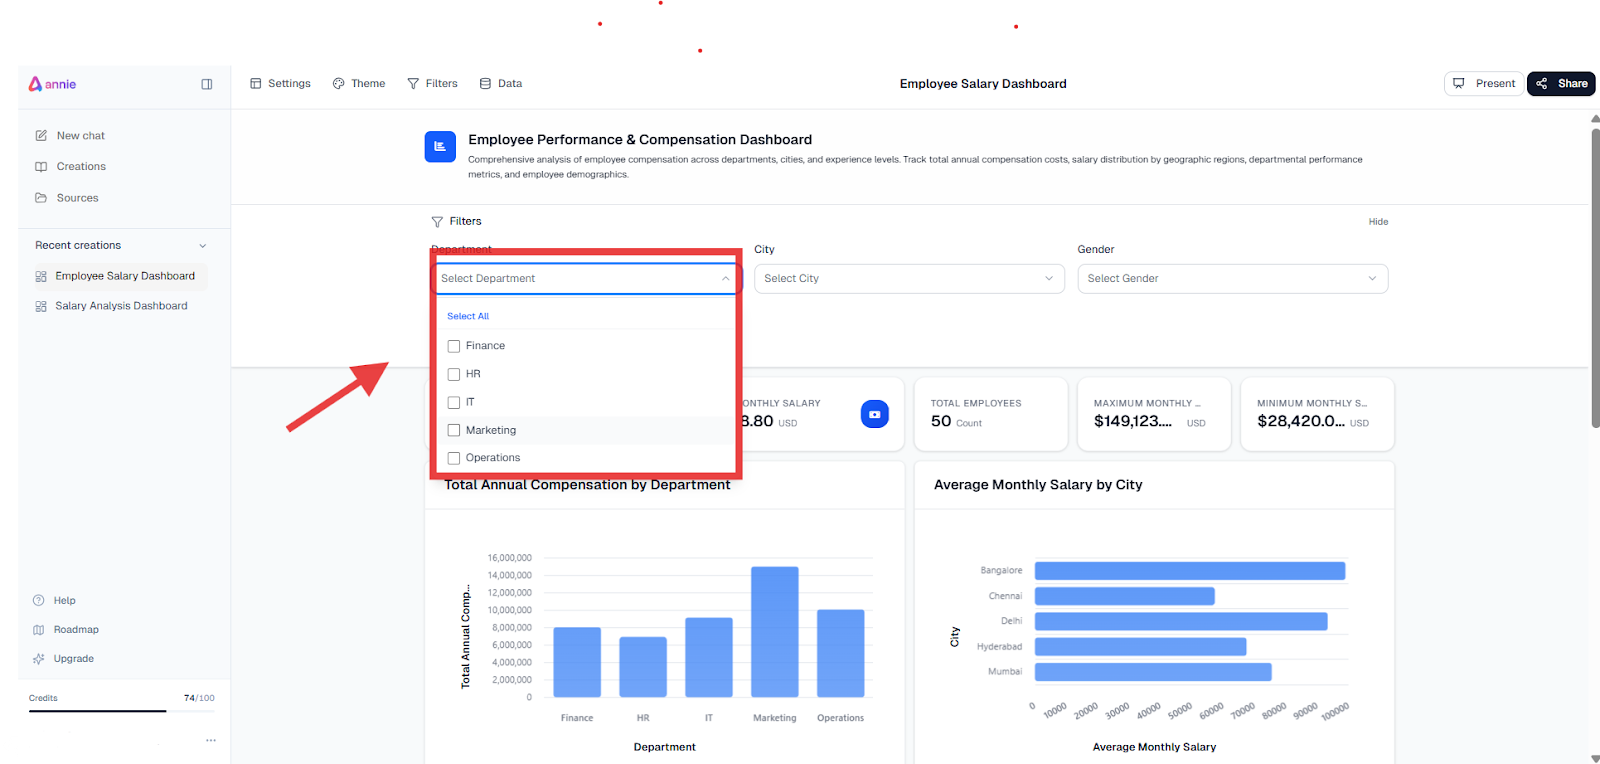
Not everyone uses data in the same way. Even when teams look at the same dataset, their questions, priorities, and level of detail are very different. BI that adapts to every user recognises these differences and supports each role without forcing a single workflow.
Executives: High-Level Direction and Confidence
Executives are not looking for detailed tables or complex breakdowns. They want to understand:
- Are we on track?
- Where are the risks?
- What has changed recently?
Their exploration usually focuses on:
- Overall trends
- Key performance indicators
- Clear signals that require attention
Adaptive BI helps executives move quickly from a high-level view to a focused explanation when something looks off, without overwhelming them with unnecessary detail.
Sales Teams: Momentum and Day-to-Day Performance
Sales teams work with fast-moving data and need to react quickly.
They typically explore:
- Daily or weekly performance
- Pipeline movement
- Regional or individual results
- Sudden drops or spikes
Instead of static reports, sales users benefit from flexible exploration that lets them compare periods, zoom into specific segments, and understand what is driving changes in performance.
Marketing Teams: Campaigns and Impact
Marketing teams explore data to evaluate effectiveness and optimise efforts.
Their questions often include:
- Which campaigns are performing best?
- How are different channels contributing?
- What changed after a campaign launch?
They need to compare results across time, audiences, and channels, and quickly adjust their view as new data comes in.
Finance Teams: Variances and Explanations
Finance teams focus on accuracy and accountability.
Their exploration is often centred on:
- Variances between actuals and forecasts
- Period-over-period comparisons
- Understanding why numbers differ from expectations
Adaptive BI allows finance users to move from a high-level variance to a detailed explanation without rebuilding reports or waiting for new analysis.
One Platform, Multiple Ways of Exploring
The key difference is not the data itself, but how each role explores it.
When BI adapts to users:
- Each role starts from what matters most to them
- Exploration feels natural, not forced
- Teams get answers without technical friction
This flexibility is what makes BI useful across the entire organisation, not just for specialists.
Why adaptive BI improves decision-making
When Business Intelligence adapts to how people explore data, decision-making becomes simpler and more effective.
Adaptive BI helps teams:
- Find relevant information faster
- Reduce confusion caused by irrelevant metrics
- Focus attention on meaningful changes
- Build confidence through better understanding
Instead of spending time navigating dashboards or requesting new reports, users move directly from questions to insights. This reduces delays, improves alignment across teams, and makes decisions more grounded in context rather than isolated numbers.
Over time, this also increases BI adoption. When tools are easy to use and genuinely helpful, more people rely on them as part of their daily work.
Business Intelligence is most effective when it adapts to people, not when people are forced to adapt to tools. By supporting Exploratory Data Analysis, conversational interactions, visual exploration, and shared insights, adaptive BI becomes accessible to non-technical users while remaining powerful enough for complex decision-making.
As BI continues to evolve, the focus will shift further away from static dashboards and toward flexible, human-centred experiences. BI will increasingly act as a daily decision partner, helping every user explore data, understand change, and act with confidence.