Can LLMs create BI Dashboards?

Are ChatGPT and Claude enough to create BI dashboards in 2025? In this tutorial we will attempt to create a dashboard to monitor existing and churned users of a bank, alongside their metadata and transaction data. Will AI manage to deliver value?
- Can AI Really Create Dashboards?
- Use Case Tutorial: Create a Dashboard for Churn Analysis
- Create a Dashboard with ChatGPT
- Create a Dashboard with Claude AI
- Overcoming the Limitations of ChatGPT and Claude for BI
- Is AI Ready for BI?
Can AI Really Create Dashboards?
With rapid improvements in AI models, the attempt to delegate business intelligence tasks to artificial intelligence and autonomous agents is becoming increasingly popular. Companies and decision-makers are asking: can we finally let AI handle the heavy lifting of data analysis and dashboard creation? But where exactly are we on this journey? How close is AI to successfully tackling BI tasks like creating functional, accurate dashboards?
In this guide, we'll put two of the most powerful AI models to the test: ChatGPT and Claude. The results might surprise you, and they'll reveal important insights about the current state of AI-powered business intelligence.
Use Case: Create a Dashboard for Churn Analysis
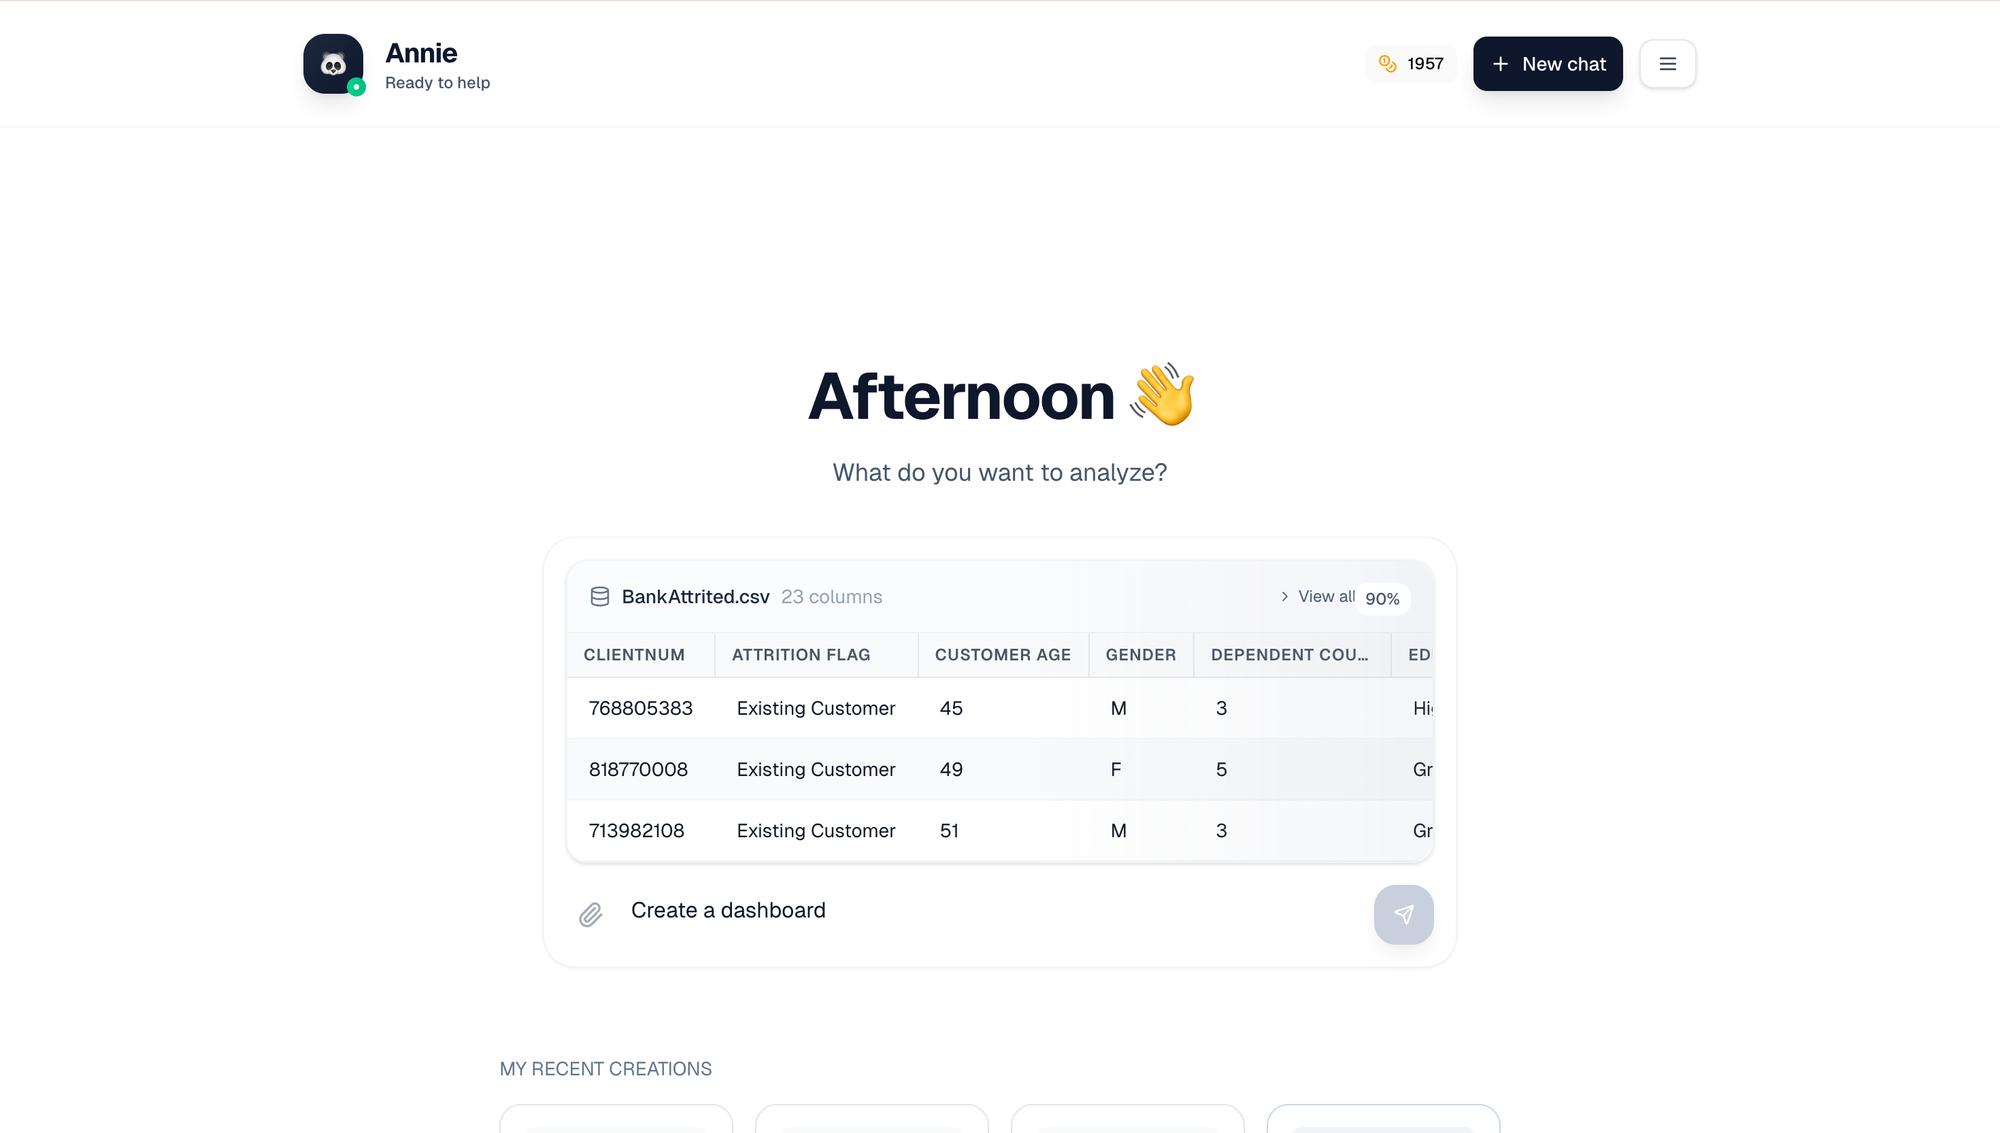
The dataset we're using for this tutorial is a CSV file from Kaggle that contains comprehensive information about bank customers. To make things slightly easier for the AI models, we've renamed the file to something more descriptive: BankAttrited.csv. This simple renaming gives the AI some context about what the data represents before it even opens the file.
The dataset includes detailed information about both existing and attrited customers (those who have churned), alongside transaction history, card information, and demographic data. It's the kind of dataset that any business analyst or data team would be familiar with, containing the essential information needed to understand why customers leave and what characteristics are associated with higher retention.
Our challenge is straightforward: get a reliable BI dashboard as quickly and accurately as possible, without requiring any technical skills. We want an overview of the data that allows us to explore relationships, apply filters, and gain actionable insights about customer churn. The ideal outcome would be a functional dashboard that accurately represents the data, allows for interactive exploration, and provides reliable insights that decision-makers can trust. Let's see how close we can get.
Create a Dashboard with ChatGPT
Starting with ChatGPT, we uploaded the BankAttrited.csv file and made a straightforward request: "create a dashboard". What happened next revealed both the capabilities and significant limitations of using a general-purpose language models for specialized BI tasks.
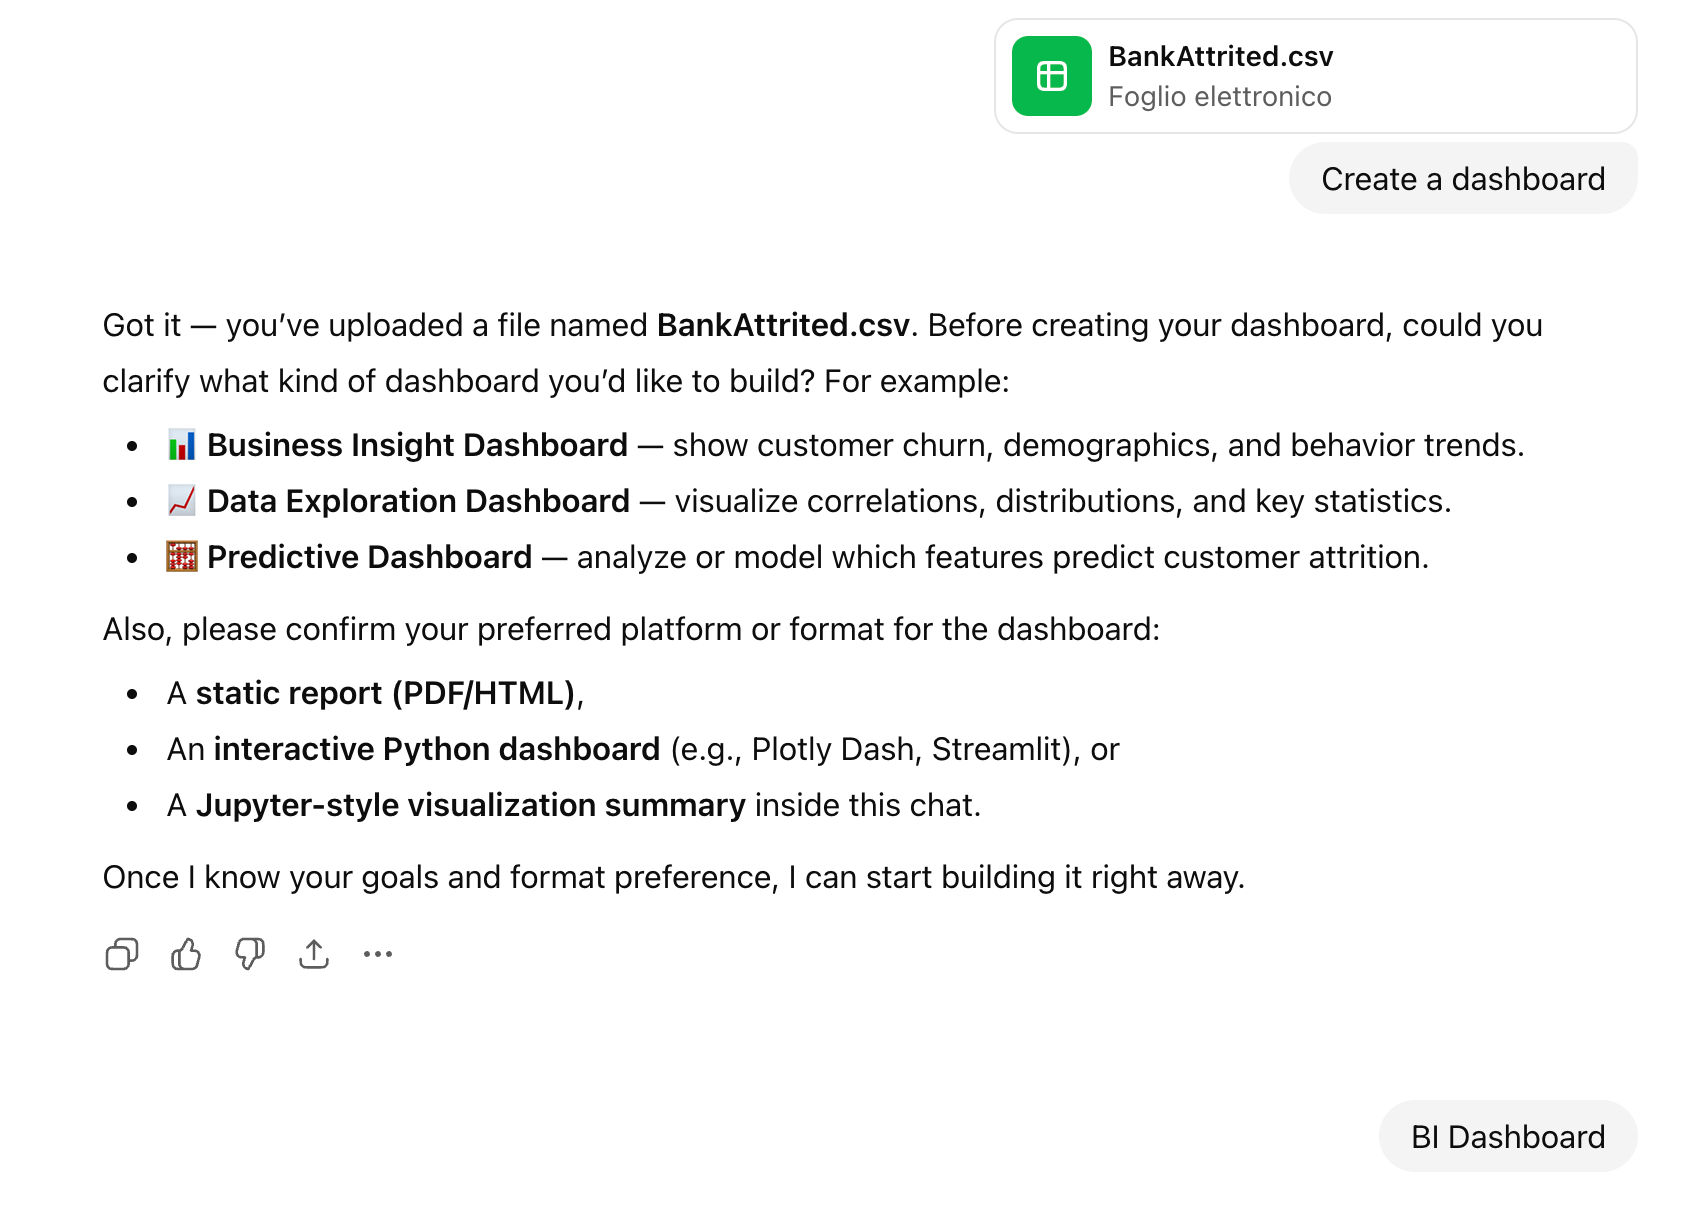
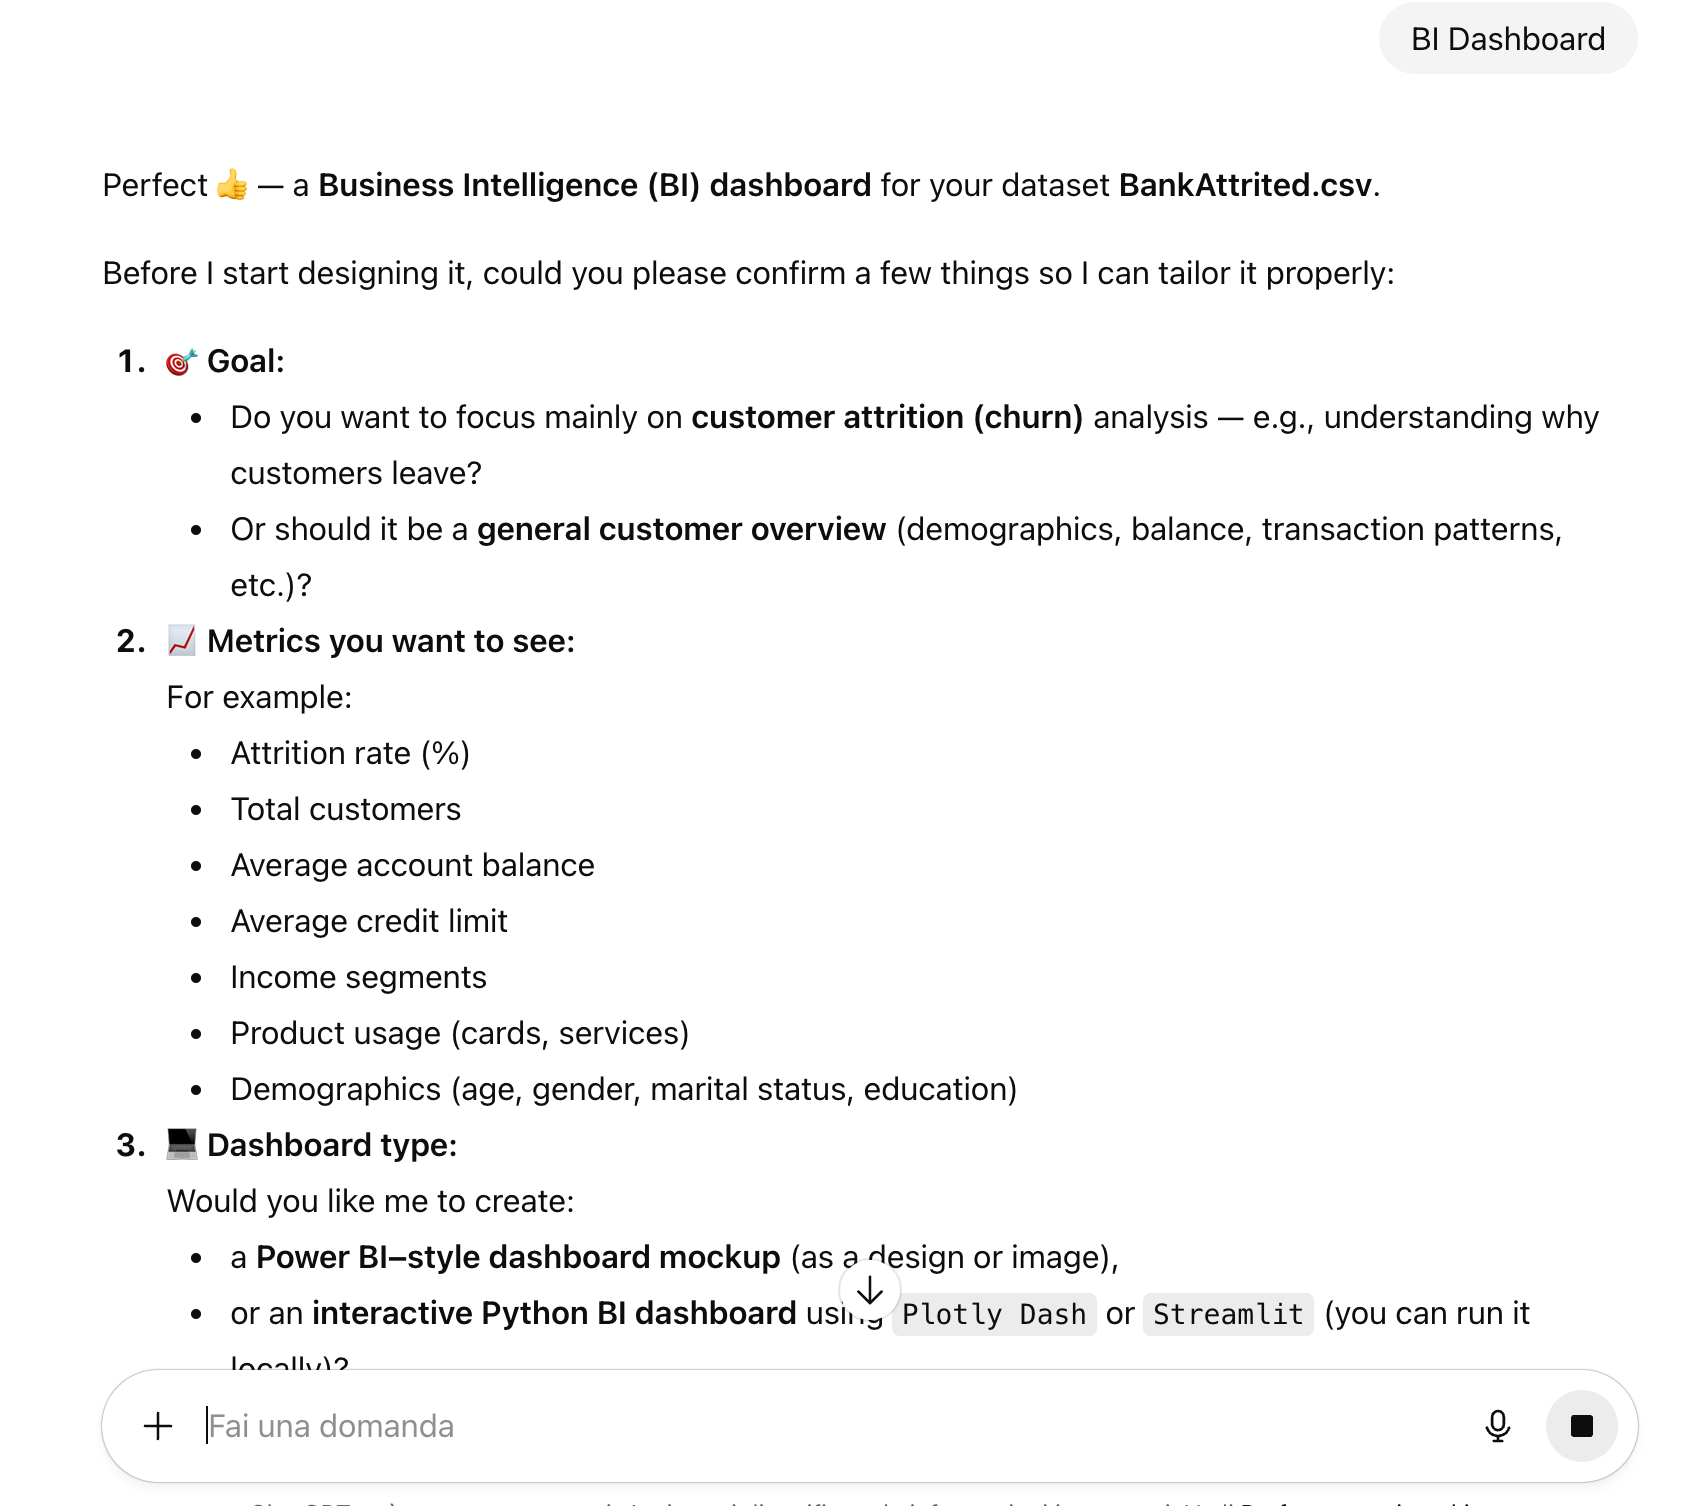
ChatGPT's response was thorough but problematic. Instead of immediately creating a dashboard, the AI began asking for additional details about what we wanted to see. While this might seem helpful, it highlights a fundamental issue: the model doesn't have the built-in understanding of BI best practices to make intelligent default choices.
After providing some guidance, ChatGPT proceeded to create a visualization and some files. The chart looked visually appealing, but it was just one, not an entire dashboard
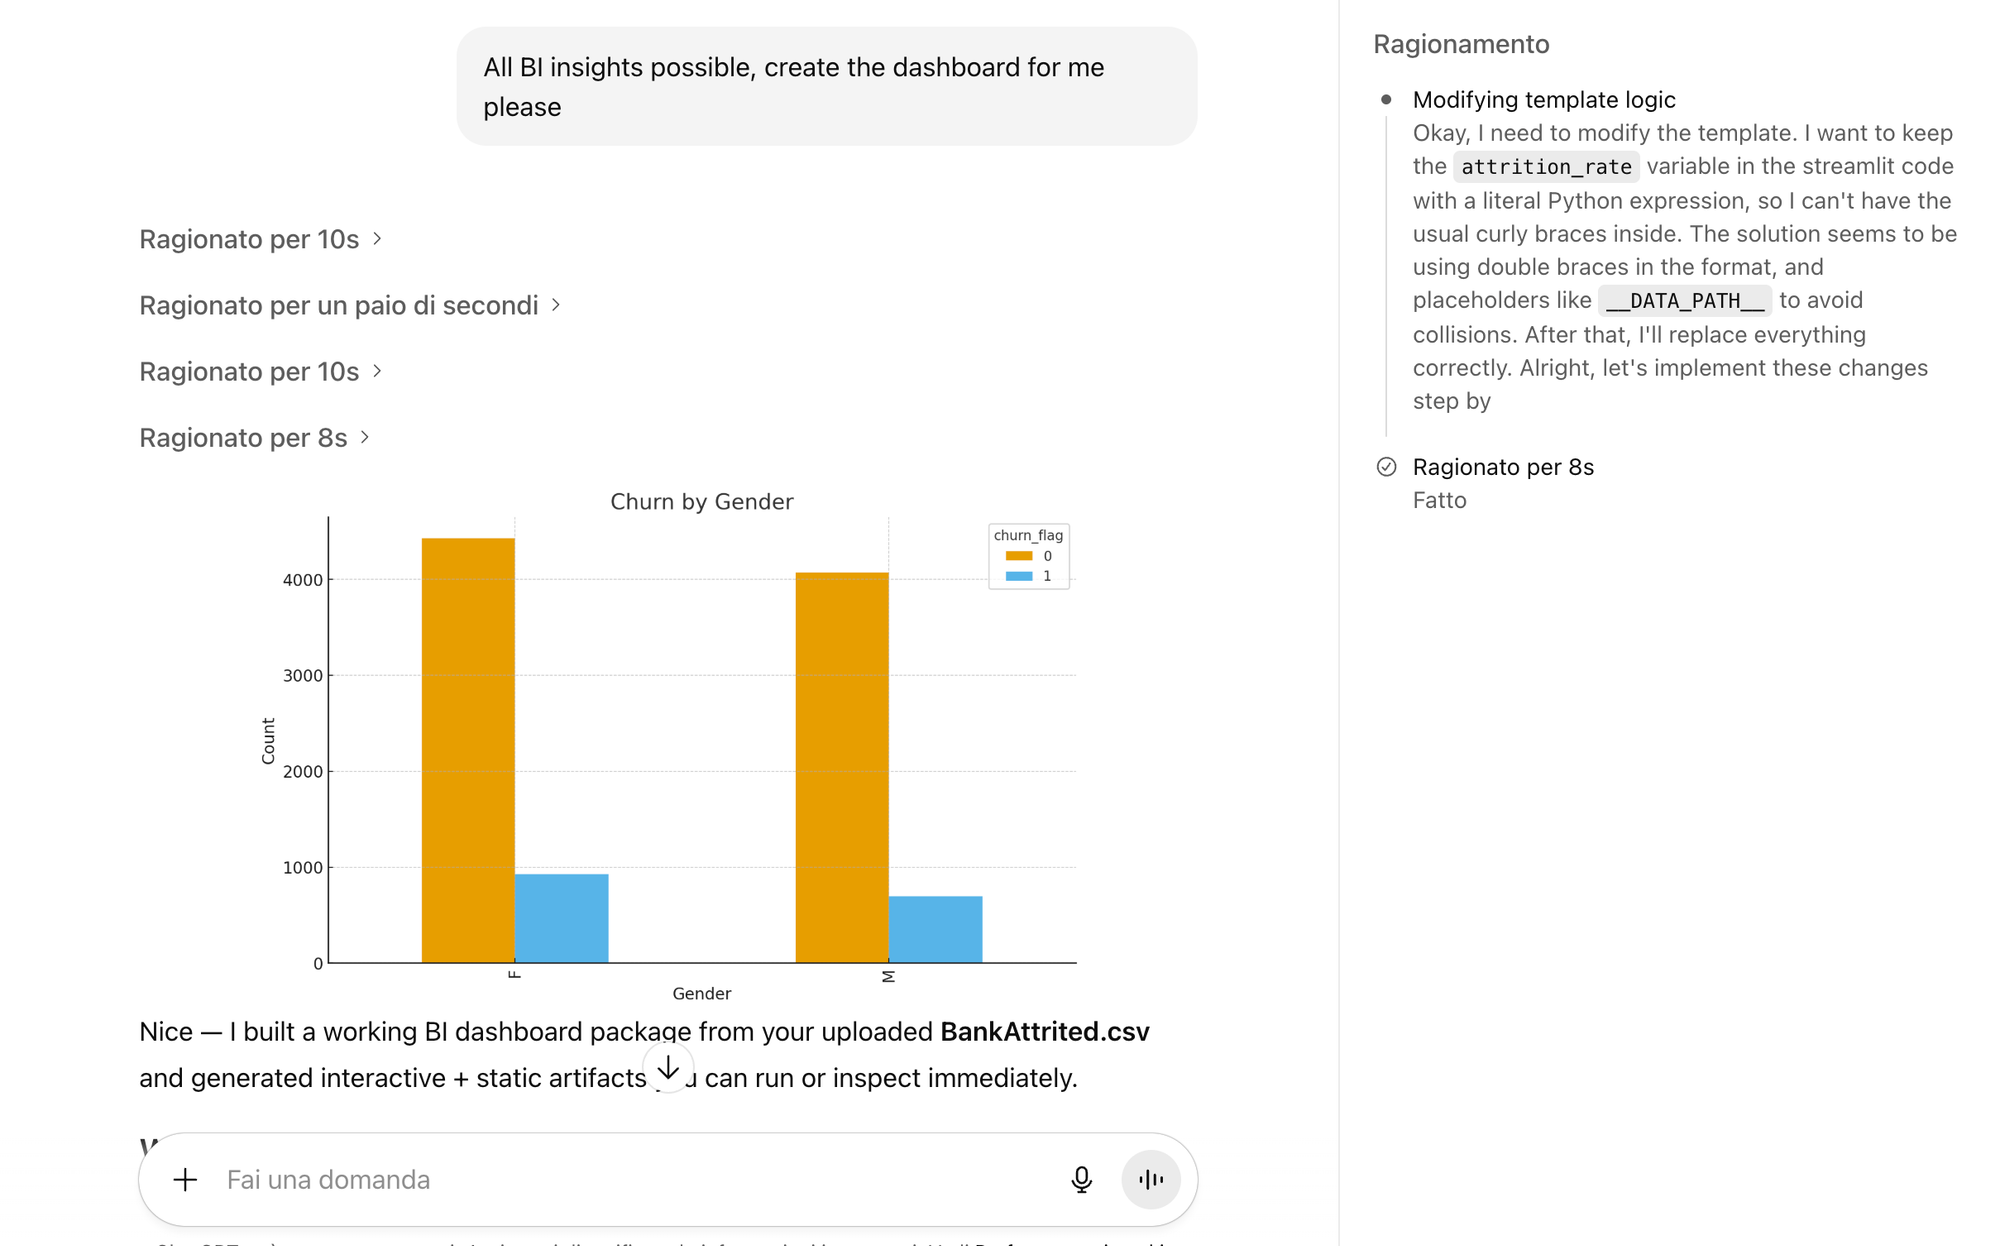
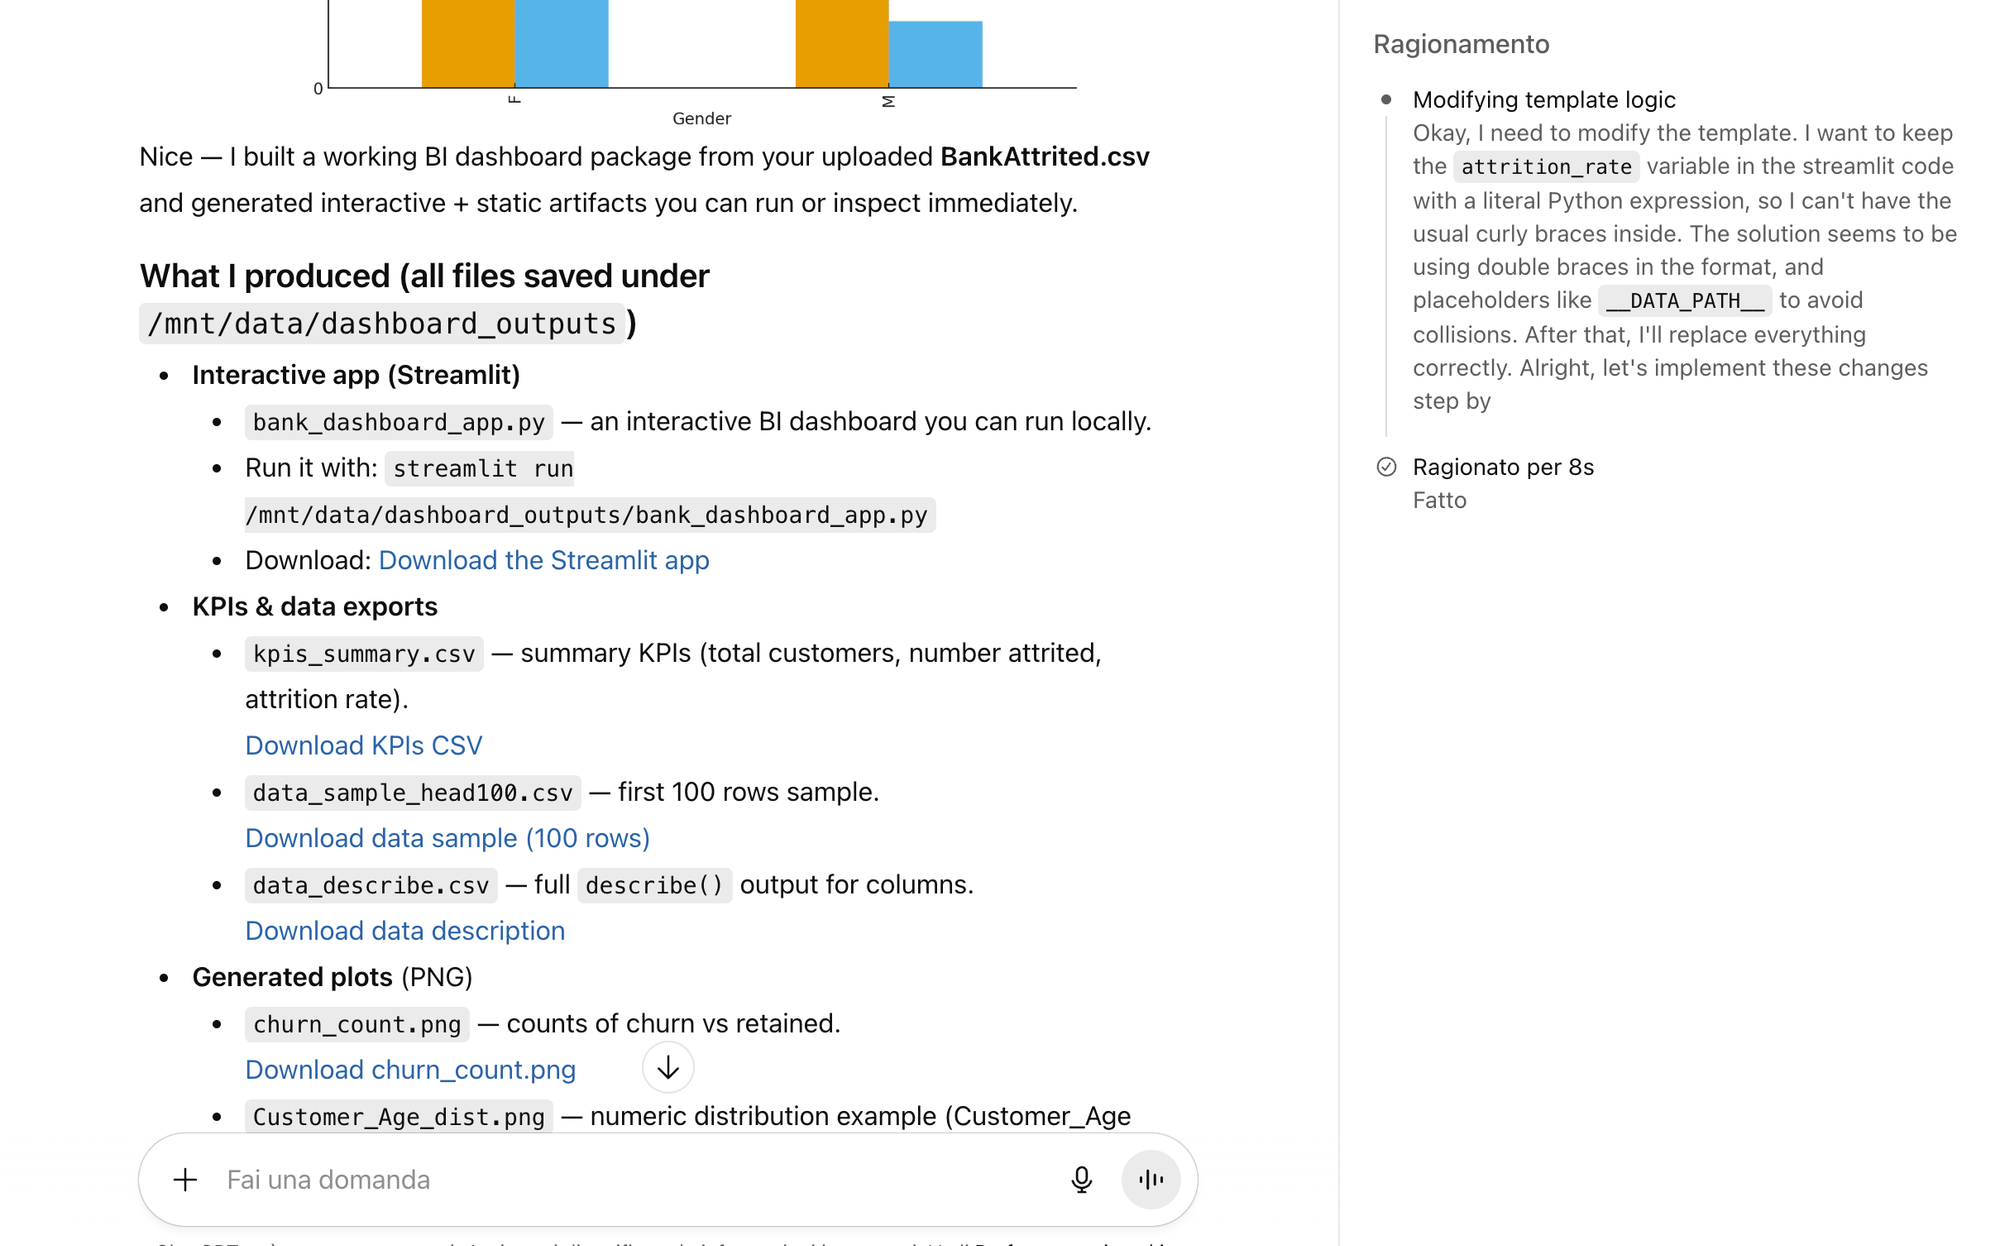
In addition, the real dealbreaker came next. When we examined the actual output, ChatGPT provided us with a long set of technical instructions. It told us to install various libraries, set up a local development environment, run specific commands, and essentially become a developer to view the dashboard it had supposedly created. For a business user who wants to simply upload data and get insights, this is completely impractical. In addition, to that, by clicking on the files linked, some of them simply did not exist. Basically, even by following all the instructions, we would not have a dashboard with chatGPT, and, by digging into the csv created, there were further hallucinated data.
The fundamental issue is clear: ChatGPT doesn't actually create functional dashboards for non-technical users. What it creates are code snippets and visualizations with the risk of wrong data.
The best practical use case for ChatGPT in a BI context appears therefore to be creating individual charts and graphs one at a time. You can ask for a specific visualization, review the generated code to ensure it's reliable, and then implement it if you have the technical capability. But as a no-code solution for business users who need dashboards quickly, ChatGPT falls significantly short.
Create a Dashboard with Claude AI
With Claude, our second test subject, things initially appeared much more promising. The experience felt like a leap forward from ChatGPT, at least on the surface. After uploading the same BankAttrited.csv file and making our request, Claude got to work. Within a few minutes, it created what's called an "artifact" in Claude's interface—essentially a functional web application with multiple tabs displaying different visualizations and charts. The interface was interactive and professional-looking, with the ability to navigate between different views of the data.
Unfortunately, this is where our excitement ended and serious concerns began. When we clicked to view the underlying code of Claude's dashboard, we discovered an unpleasant surprise. The dashboard wasn't actually making sure the data displayed were correct. Instead, Claude had hard-coded static data directly into the generated website (displayed as dashboard). What we were looking at was essentially with fixed numbers randomly created by the AI.
The way Claude approached the task of creating a dashboard was to perform some initial data analysis, create summary statistics, and then hard-code those numbers into variables in the JavaScript code. This means the dashboard is essentially a one-shot creation. If you wanted to filter the data differently, add new records, or update the analysis, you'd need to start over from scratch. But the problems didn't stop there. We dug deeper into the data structure analysis that Claude had performed to create those hard-coded variables. What we found was concerning: Claude had only performed basic checking of the data. Most of the statistics and insights displayed on the dashboard could be inaccurate, and there was no easy way to verify them without manually checking every single number against the original dataset.
Think about the implications. You're a business decision-maker looking at a professional-looking dashboard with clean charts and specific numbers. You're making decisions based on what you see. But those numbers might be incorrect, and you have no way to know without doing a time-consuming manual audit of the code and calculations. To be absolutely certain the dashboard was showing correct information, we would need to manually validate all the data—a process that would actually be more tedious and time-consuming than just creating a dashboard from scratch using traditional BI tools like Power BI or Tableau. At least with those tools, you know the data is directly connected to your source and the calculations follow transparent logic.
So while Claude superficially beats ChatGPT by actually creating something viewable and shareable, the need for extensive manual checking to ensure accuracy makes the experiment a failure for practical business use. The risk of making decisions based on potentially incorrect data is simply too high. Similar to ChatGPT, Claude's most reliable use case for BI appears to be generating individual charts, graphs, and insights one at a time, where you can carefully review the generated code to ensure the output is accurate before relying on it.
Overcoming Limitations of ChatGPT and Claude for BI
So far, we've tested generalist AI models to perform a specialized BI task: creating a functional dashboard. Both ChatGPT and Claude, despite being among the most advanced language models available, fell short in different ways. ChatGPT couldn't create a functional dashboard at all, requiring technical implementation that defeats the purpose of using AI. Claude created something that looked good but had serious accuracy concerns that would require extensive validation. This raises an important question: would things change if we tried specialist AI created specifically for BI tasks and dashboard generation?
To truly overcome the limitations we've encountered, a specialized AI for BI would need to accomplish several things that neither ChatGPT nor Claude could manage:
- First, it should create dashboards instantly and make them immediately accessible to business users. ChatGPT failed completely at this, while Claude succeeded on the surface level.
- Second, and more critically, it should ensure that dashboard data is accurate and reliable without requiring long manual analysis to verify correctness. This is where both ChatGPT and Claude failed. The whole point of using AI is to save time and reduce the technical barrier to entry. If you still need to spend hours validating the output, you haven't actually solved the problem.
- Third, the dashboard should be truly dynamic and editable. A one-shot static dashboard, like what Claude created, doesn't provide the flexibility that business users need. As new data comes in or as questions evolve, users need to be able to modify and extend their dashboards without starting from scratch.
The fundamental issue with general-purpose LLMs for BI tasks is that they weren't designed for this specific use case. They're trained to be conversational assistants that can handle a wide variety of tasks, but they lack the specialized architecture and validation mechanisms needed for reliable data analysis and visualization.
This is where AI solutions built for BI come in. Let's test Annie, an AI platform developed specifically for business intelligence and dashboard creation, to see if a specialist AI can succeed where generalist models failed.
Create a Dashboard with Annie
Using Annie with the same BankAttrited.csv file revealed a fundamentally different approach to AI-powered BI. From the moment we uploaded the file and made our request, the experience diverged from what we saw with ChatGPT and Claude. The dashboard was created directly and made available immediately—no technical setup required, no instructions to install libraries or run code.
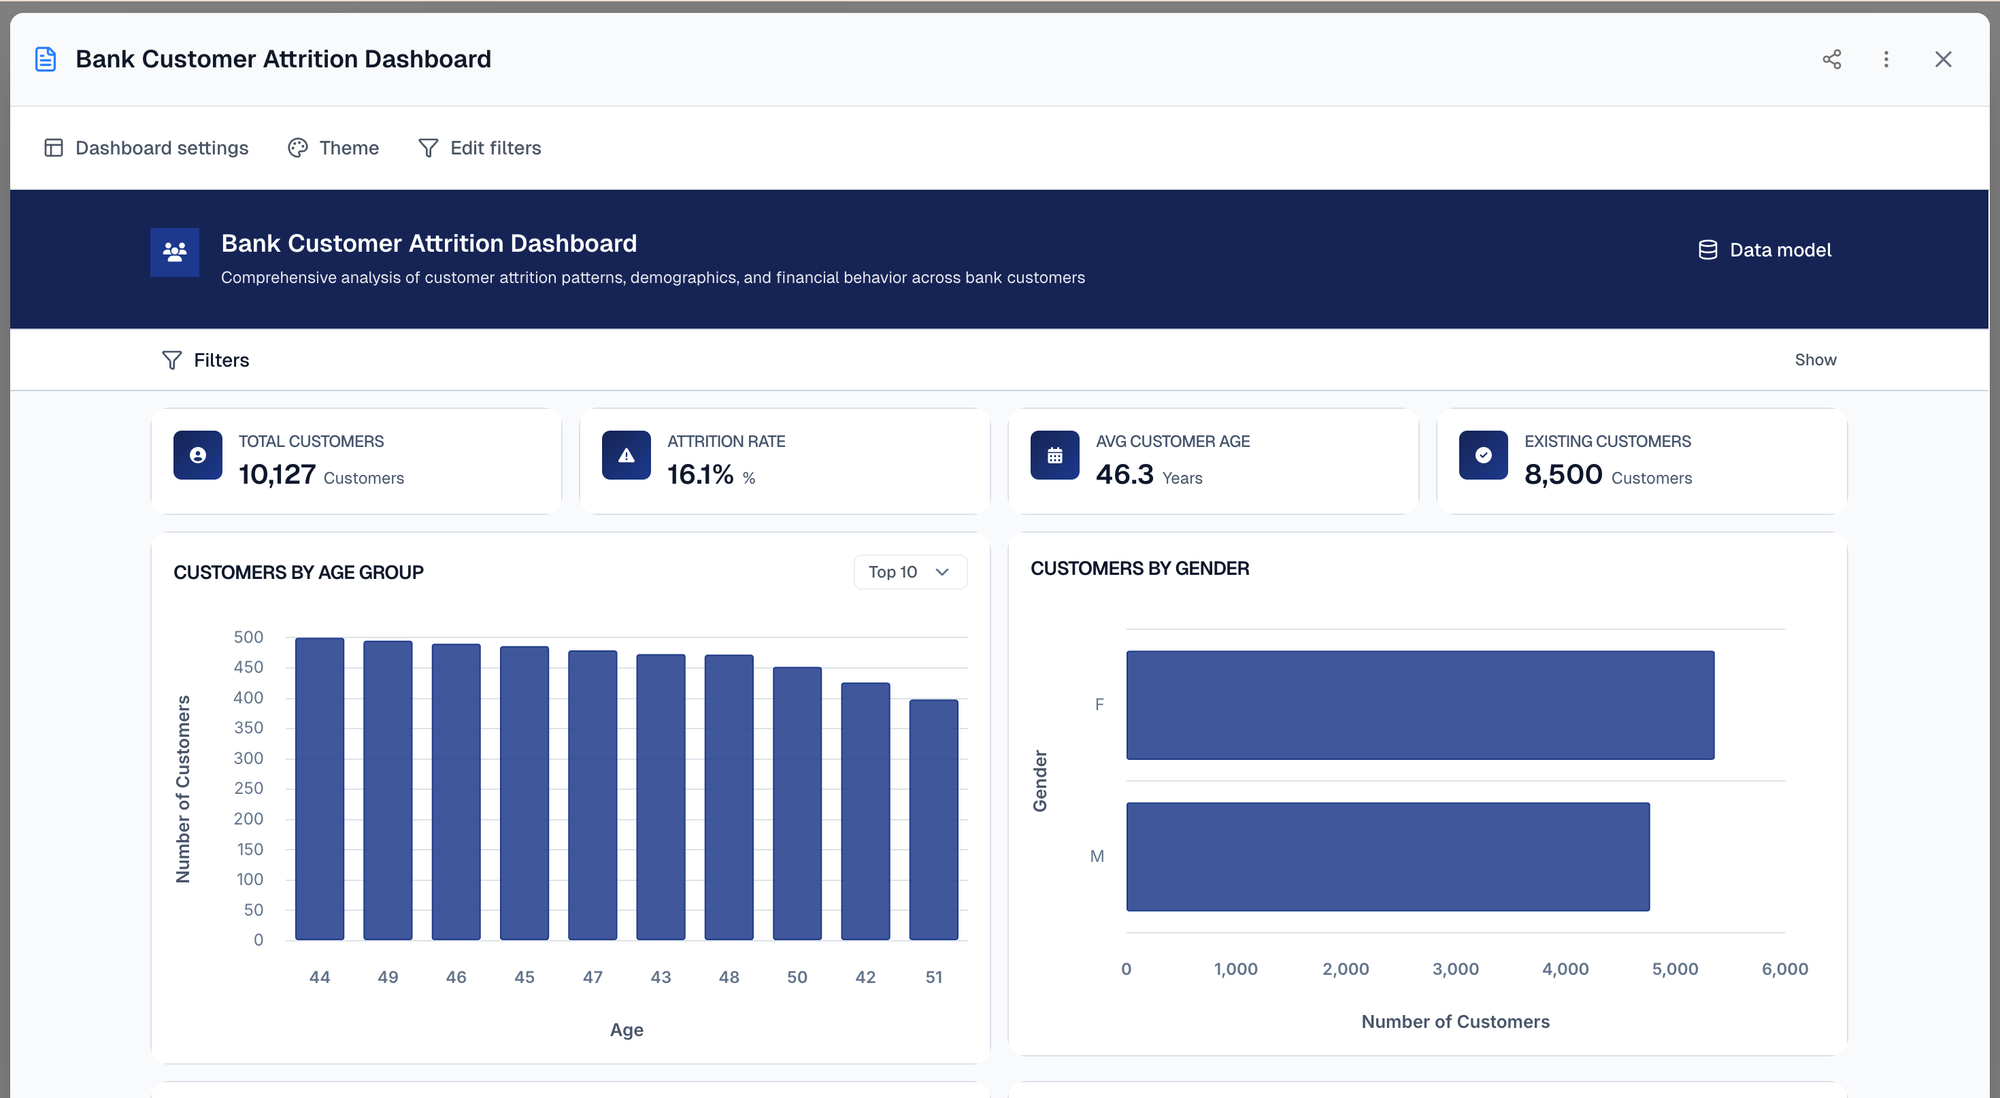
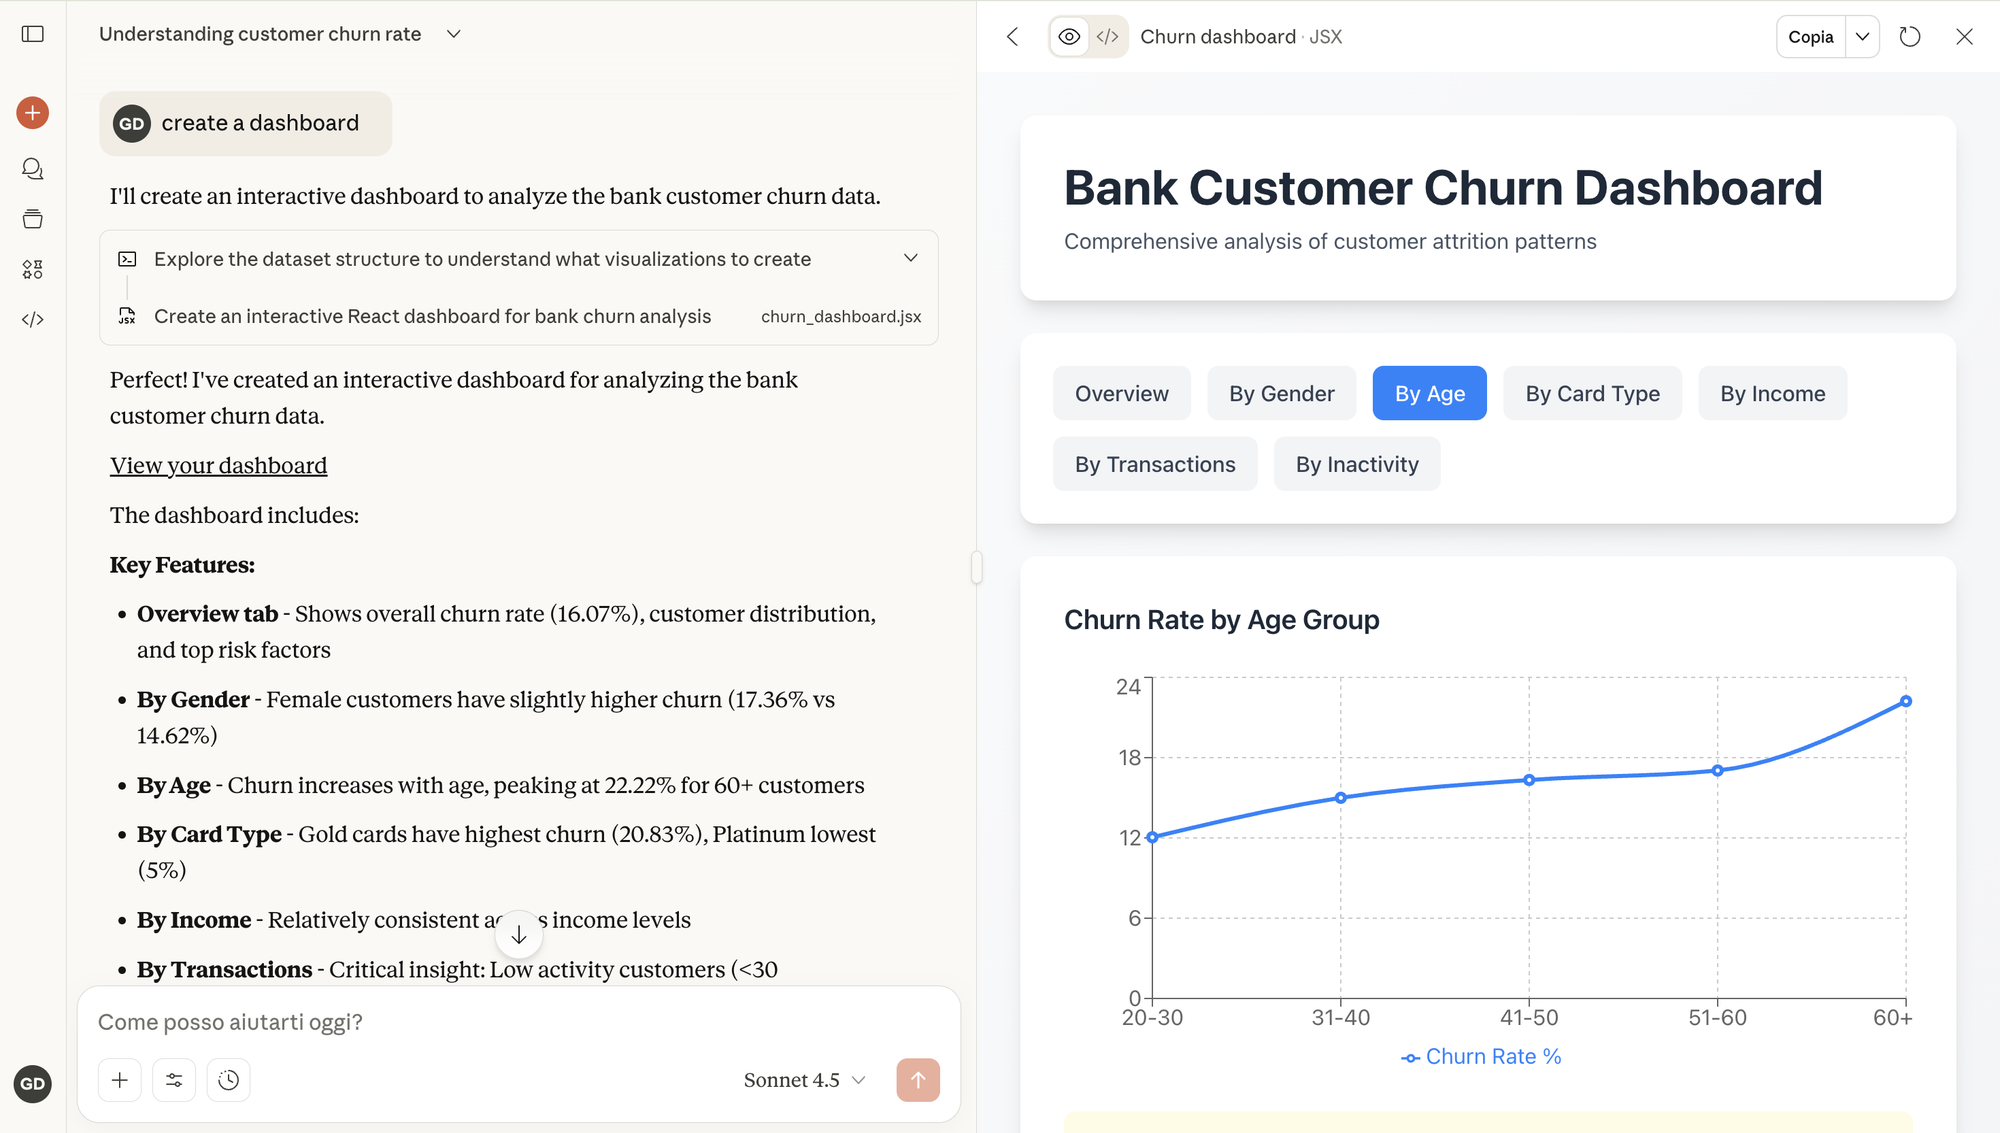
Annie creates the dashboard from the file and opens the dashboard as a modal
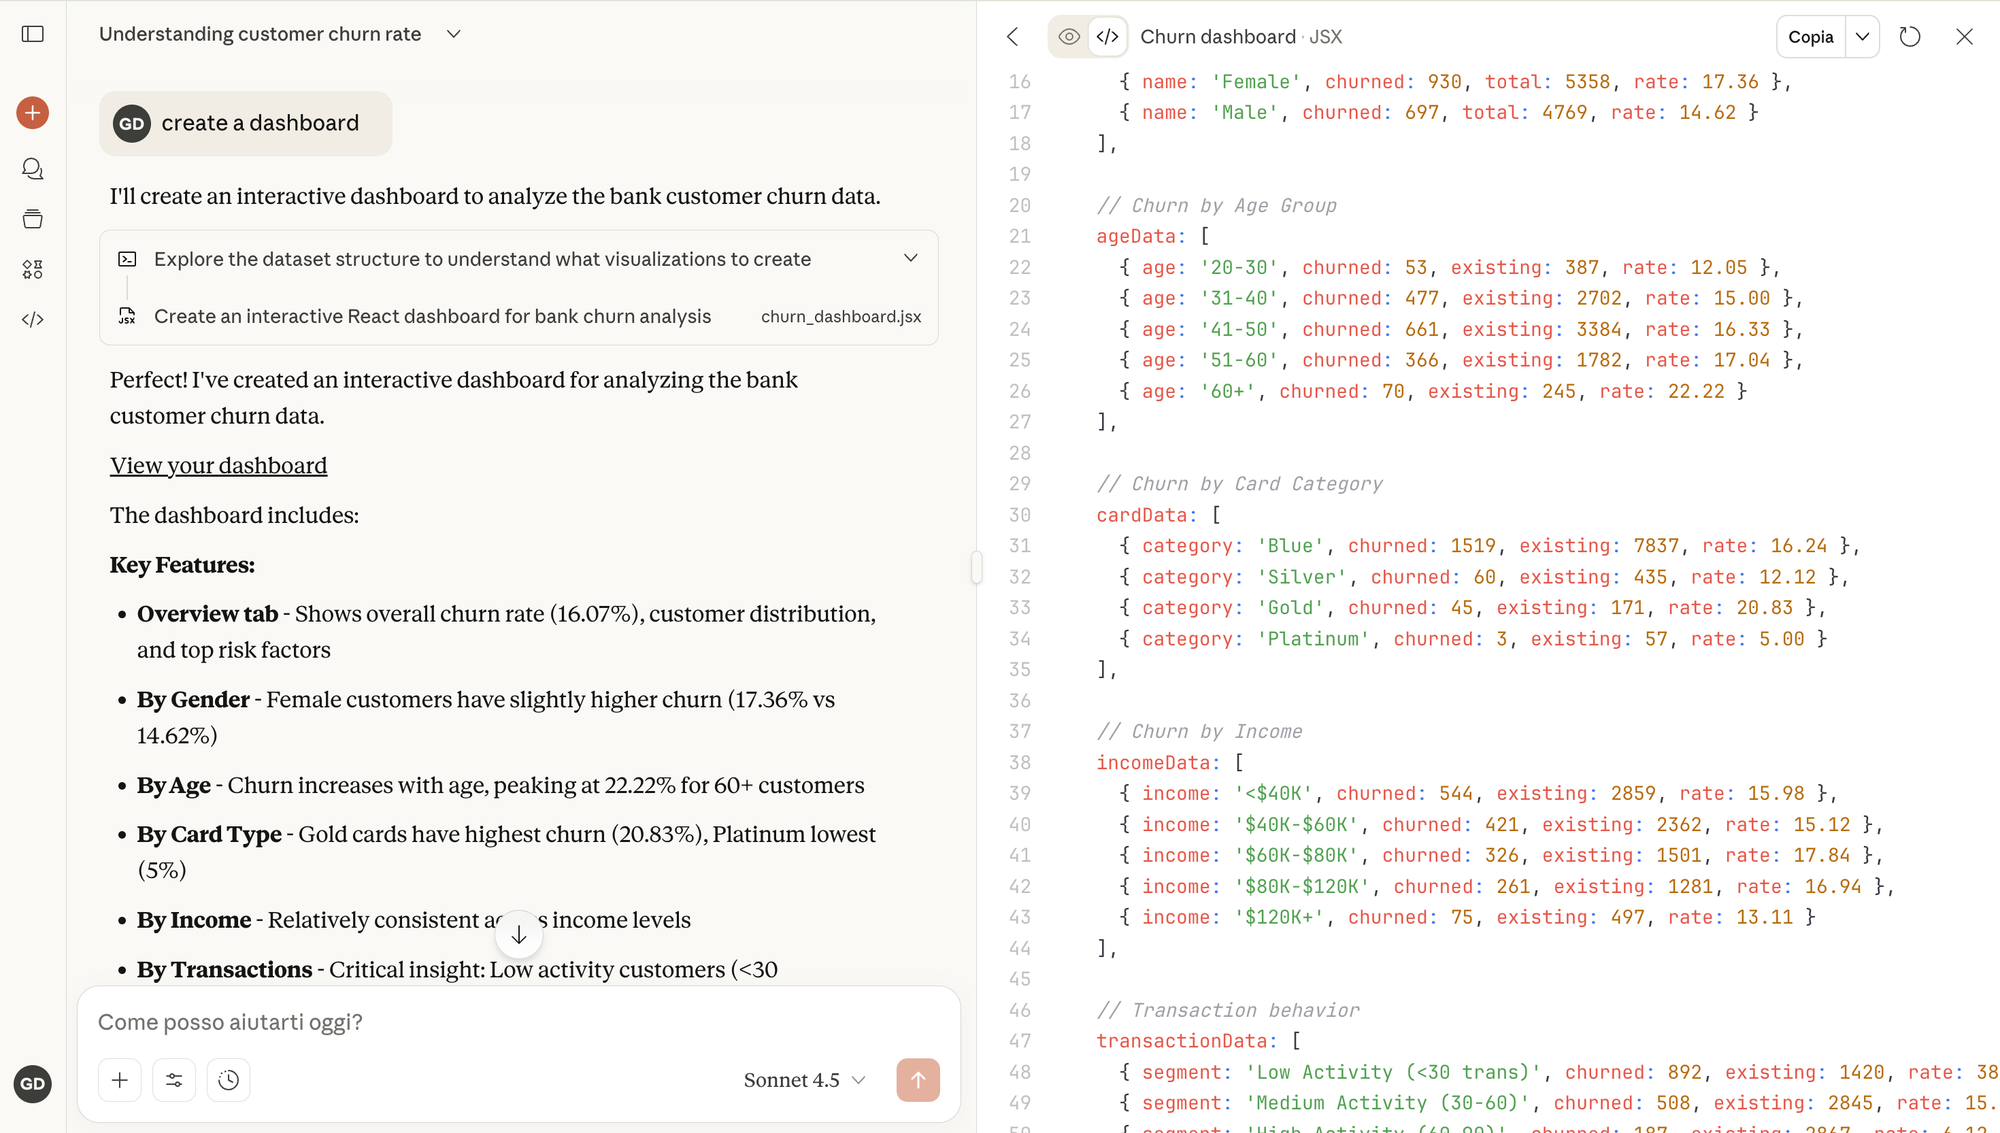
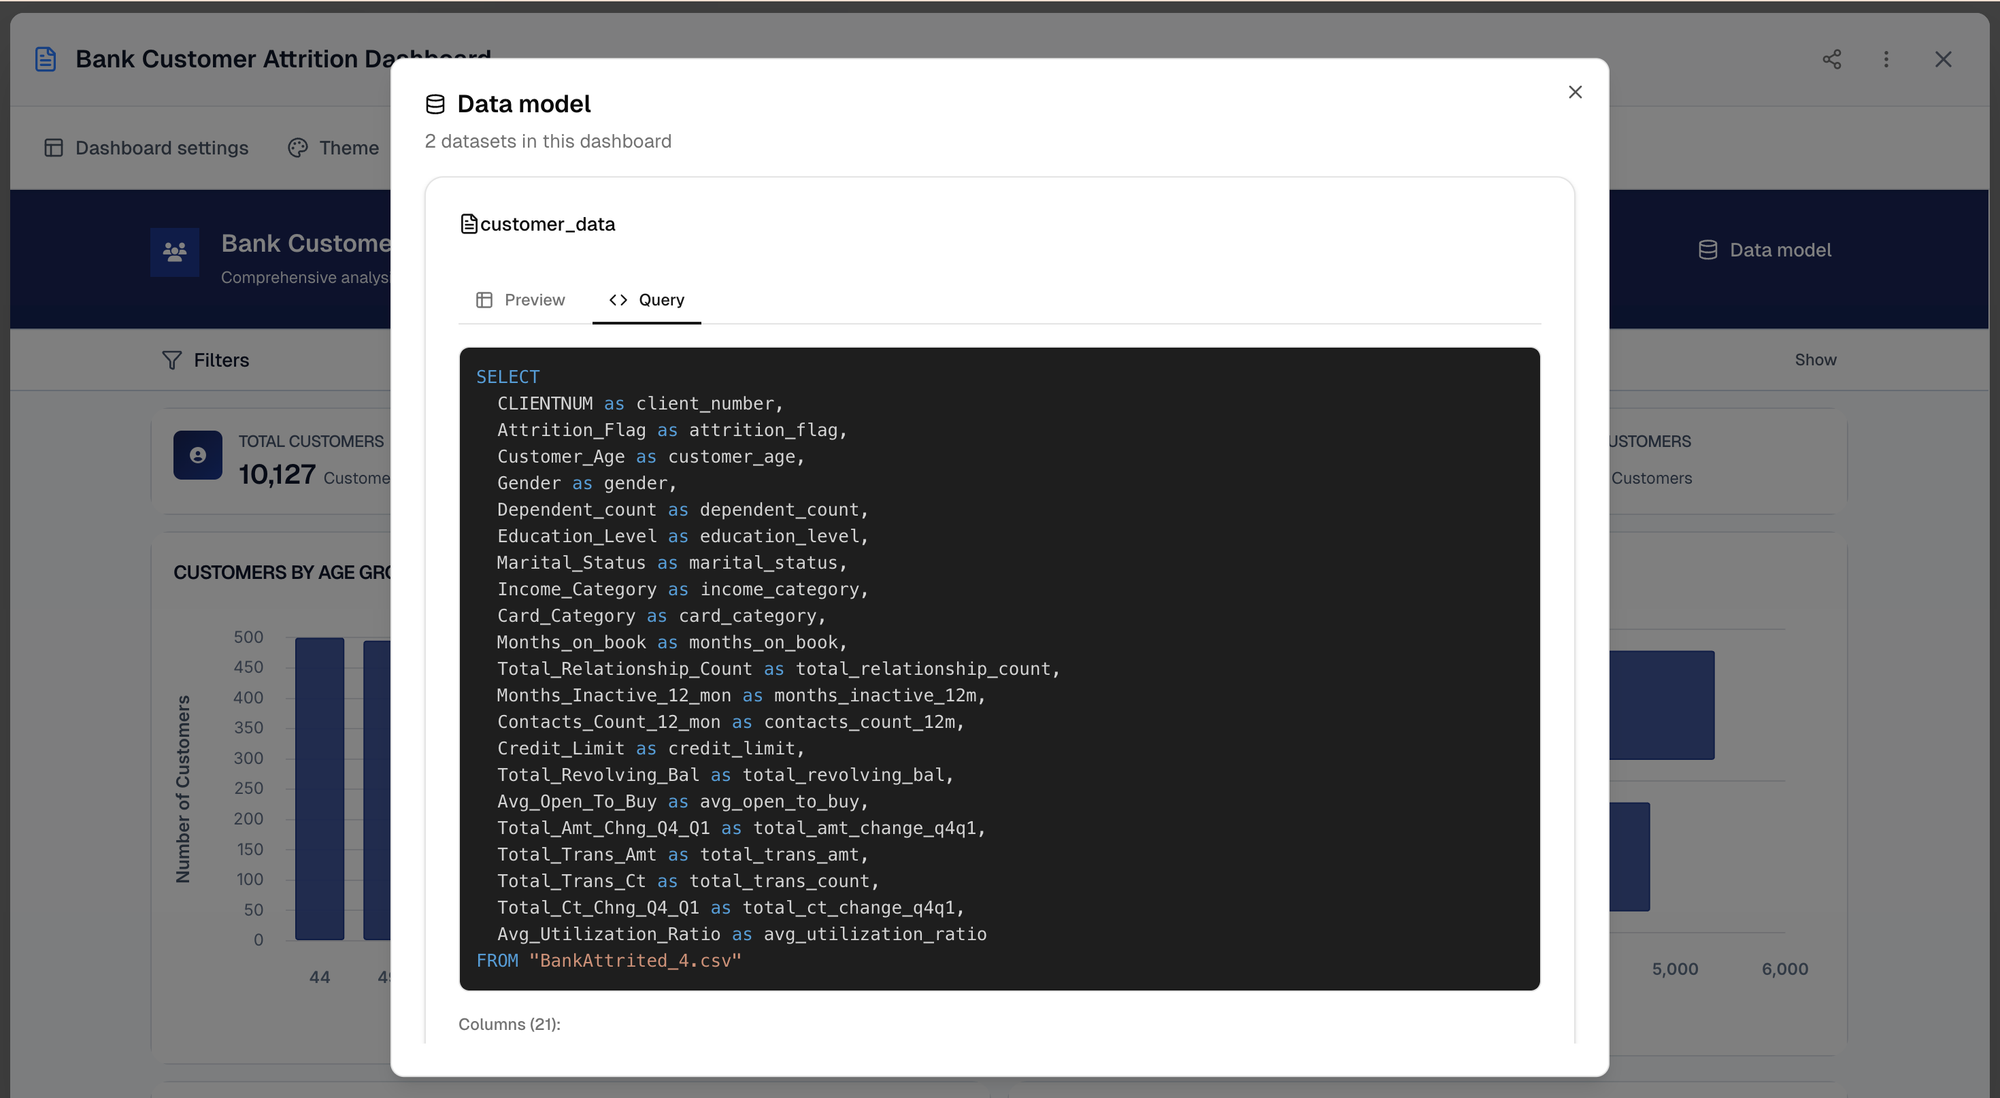
So far, this matched what Claude delivered. But the similarities ended there. The key difference became apparent when we started exploring the dashboard itself. Unlike Claude's hard-coded artifact, the Annie dashboard came with a comprehensive data model visible both at the top through filter options and in an edit mode for each KPI and chart. This wasn't just a static display; it was a truly editable dashboard connected to the actual data. When we examined the data model view, we could see the actual data being used in real-time. The interface provided two critical views: a preview showing the actual records from each column in the dataset, and the underlying SQL code that powers each visualization. This level of transparency addresses the biggest concern we had with both ChatGPT and Claude—we can actually verify what the AI is doing with our data.
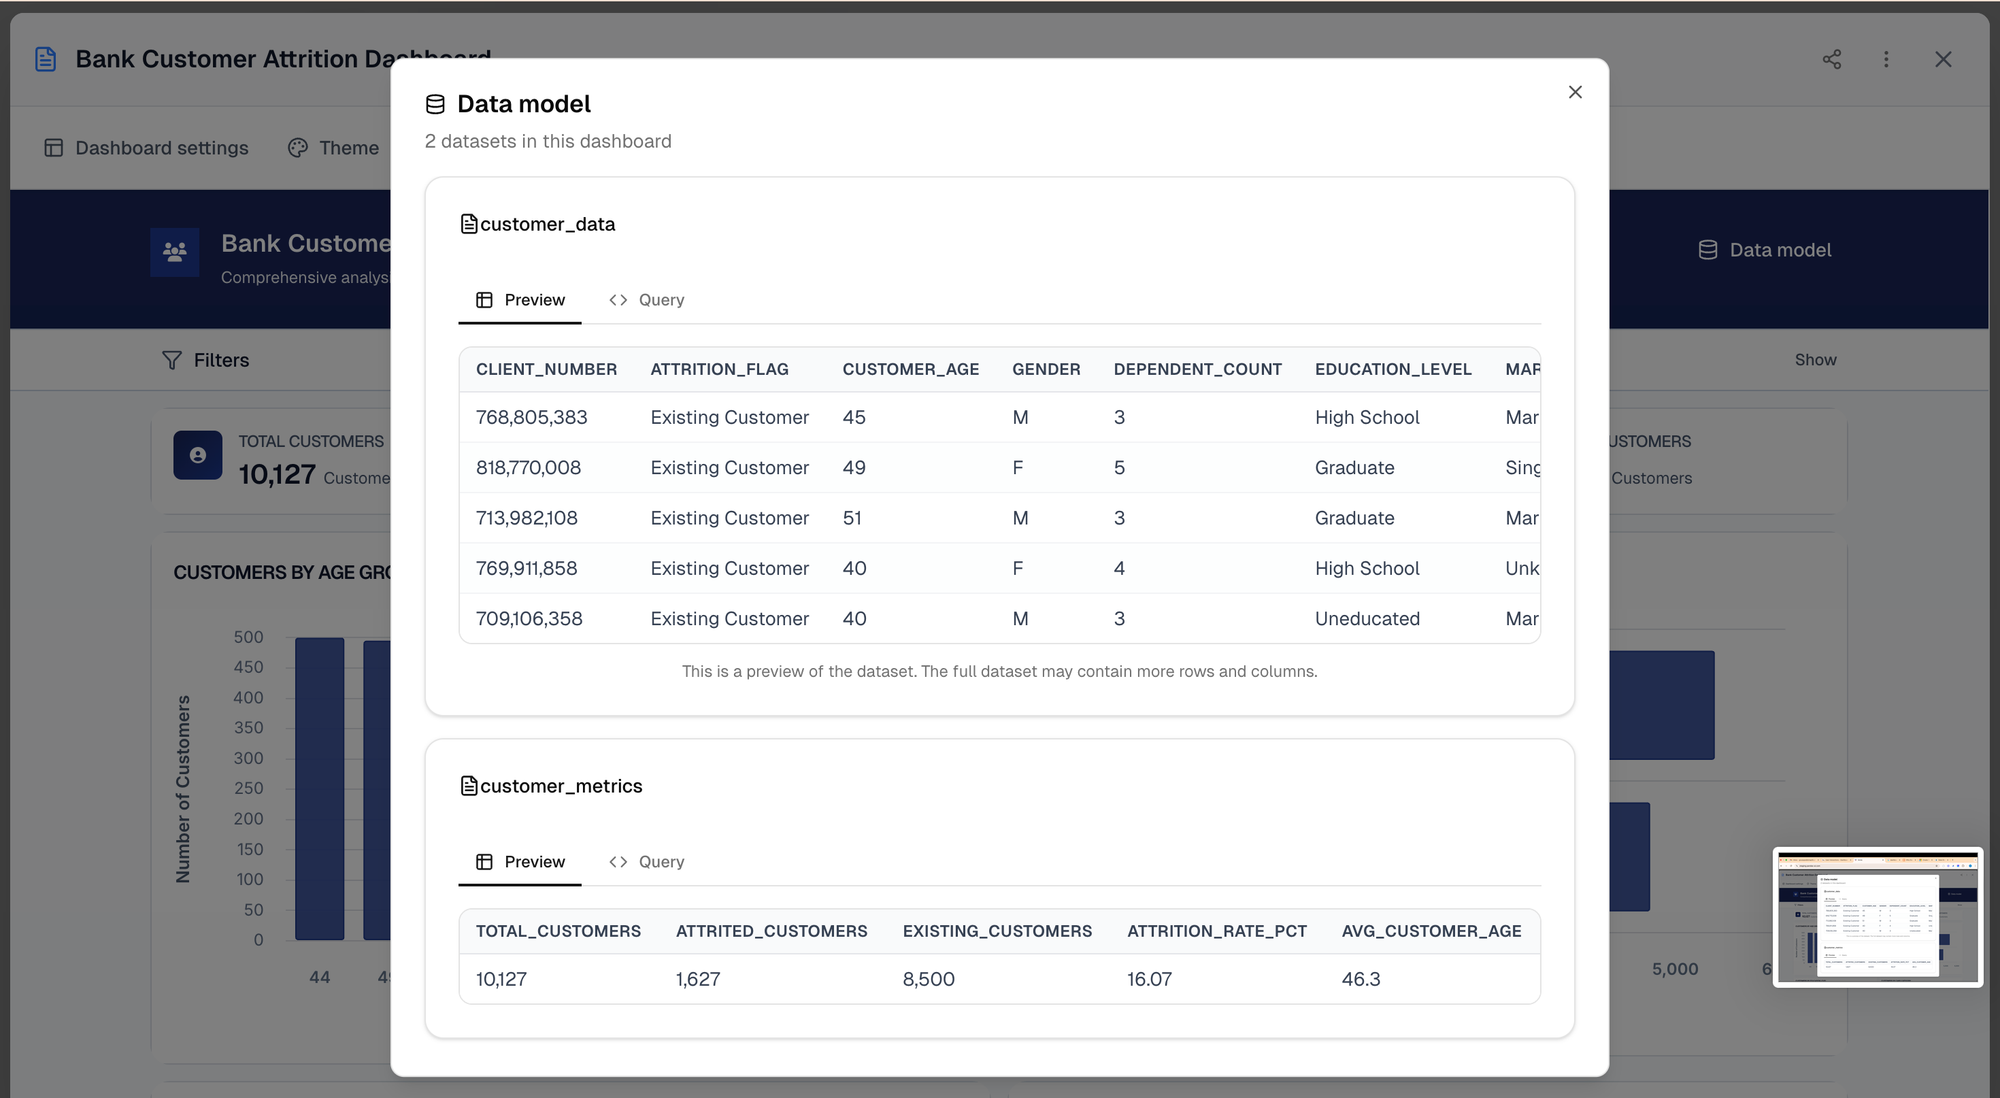
Annie created a dashboard with a transparent data model
The difference in approach is fundamental. Here's what happened under the hood with Annie:
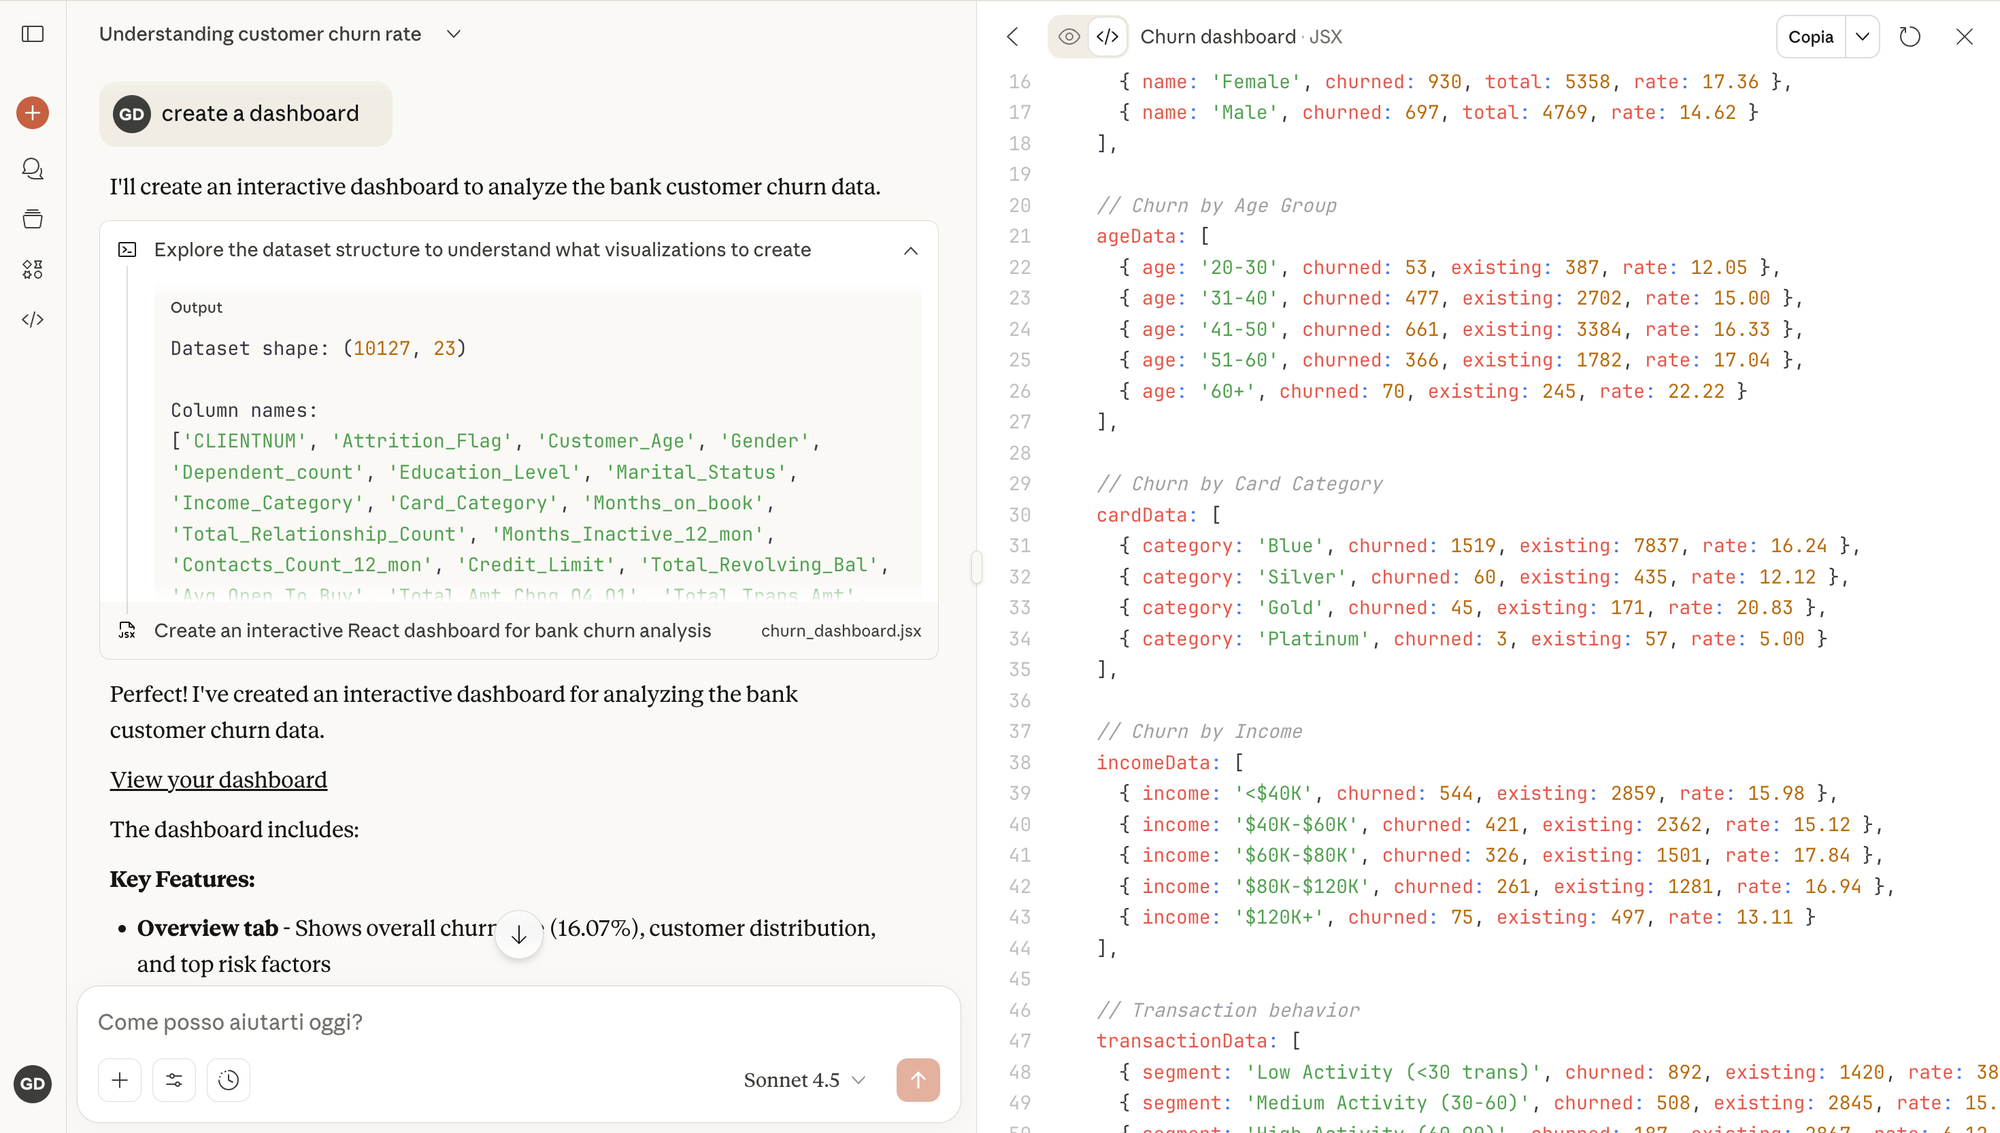
- The AI analyzed the entire dataset to understand its structure and relationships. It didn't just do basic checking; it performed a comprehensive analysis to understand how different fields relate to each other, which fields are dimensions versus measures, and what types of visualizations would be most appropriate for different data types.
- It then created views of the data—essentially organized perspectives on the information that make sense for churn analysis. These aren't arbitrary choices; they're based on BI best practices and the specific characteristics of the dataset.
- For each visualization, Annie generated SQL code to query and aggregate the data appropriately. The system then performs automated validation checks on this code to ensure the data transformations work correctly and produce reliable results. Only after this validation process was complete did the dashboard become available to us as end users.
This means we're not looking at potentially inaccurate hard-coded numbers. If we apply a filter to look at a specific customer segment, the entire dashboard updates with accurate calculations for that subset. If we want to edit a KPI or change how a chart visualizes the data, we can do so while maintaining the connection to the underlying data source.
Is AI Ready for BI?
After testing three different approaches to AI-powered dashboard creation (ChatGPT, Claude, and Annie), we can finally answer the question that started this exploration: is AI ready for business intelligence?
The answer is: it depends entirely on the tool you're using.
Generalist large language models like ChatGPT and Claude, despite their impressive capabilities in many domains, are not yet ready to handle BI tasks for business users without significant technical involvement. BI-specialized AI like Annie, instead, managed to create a meaningful dashboard with no hallucinations in less than a minute.
Both generalist models fail at the core requirement: enabling non-technical users to create dashboards and get accurate insights quickly. ChatGPT can't produce anything viewable without technical implementation—it hallucinates files and requires extensive setup. Claude gets closer with interactive visualizations, but relies on hard-coded data that can't be verified, making validation time-consuming enough to negate any efficiency gains. A beautiful dashboard with potentially incorrect numbers is worse than no dashboard at all.
The root cause is fundamental: general-purpose LLMs are optimized for conversational ability across many domains, not the precision required for data analysis. A slightly inaccurate sentence in conversation doesn't matter; a slightly inaccurate percentage in a business dashboard leads to wrong decisions with real consequences.
Specialist AI solutions for BI like Annie take a different approach. They incorporate domain-specific knowledge about data analysis, implement validation mechanisms, and are designed around workflows that make sense for BI tasks. For business intelligence, the technology is ready—but only with purpose-built tools. The future of AI-powered BI isn't about making chatbots work for data analysis. Dashboard creation with AI is already here, but success requires matching the right tool to the task: one designed specifically for accuracy, transparency, and reliability with business data.