How to Choose a Generative Business Intelligence (GenBI) Platform: a Clear Framework

Generative BI is an umbrella term covering vastly different products. Some help you query databases. Others generate charts. The most advanced build entire dashboards. Understanding these differences is the key to choosing the right platform for your business.
- What Is Generative Business Intelligence (GenBI)?
- The Three Waves of GenBI Evolution
- The Editability Problem: Why Dashboard Generation Alone Isn't Enough
- Choosing Your GenBI Platform: The Decision Framework
What Is Generative Business Intelligence (GenBI)?
At its most basic level, Generative Business Intelligence means bringing generative AI and business intelligence together. That's it. But this simple definition hides a lot of complexity.
Think of GenBI as a family of technologies rather than a single product. Just like "mobile phone" can mean anything from a basic flip phone to the latest smartphone with AI capabilities, GenBI encompasses tools with vastly different features and capabilities. Some GenBI platforms help you write database queries using natural language. Others create charts and visualizations on demand. The most advanced ones build entire dashboards automatically. What makes this confusing is that all these tools market themselves under the same GenBI banner, even though they solve completely different problems. A platform that converts your questions into SQL queries operates nothing like a platform that generates full analytical dashboards. Yet both are called GenBI.
The Three Waves of GenBI Evolution
The evolution of GenBI didn't happen overnight. It progressed through three distinct waves, each building on the previous one and enabled by improvements in AI technology:
- txt2sql: products where you connect databases and ask questions, letting the AI deal with the underlying technical query language
- txt2code: products capable of writing python code on top of the data to generate visualizations and insights through data analysis
- txt2dashboard: products that allows you to ask for and get entire dashboards alongside data narratives
These waves aren't just historical curiosities. They represent fundamentally different approaches that coexist in today's market, each with its own strengths and limitations. At the same time, keep in mind that the "three waves" framework is an abstraction designed to make this evolution easier to understand. In practice, the boundaries between waves are often blurred—capabilities frequently developed in parallel, and many platforms combine elements from multiple waves.
Wave 1 - Text2SQL: AI Learns to Query Databases
The first wave of GenBI focused on a specific but critical challenge: helping people get data out of databases without needing to know SQL. This might sound narrow, but it addresses a real pain point in the business intelligence industry.
Let's start with what SQL actually is. SQL stands for Structured Query Language, and it's the standard way to interact with relational databases. These are the tabular databases that store most business data: customer information, sales transactions, inventory records, and financial data. When you need specific information from these databases—say, total sales by region for the last quarter—you write a SQL query to extract it.
The problem? SQL requires technical knowledge. Business analysts and decision-makers often know exactly what data they need but don't know how to write the queries to get it. They end up waiting for IT or data teams to pull reports, creating bottlenecks and delays.
Text2SQL platforms emerged to solve this problem. The concept is straightforward: you type a question in plain English like "What were our top-selling products last month?" and the system converts it into a SQL query, runs it against your database, and returns the results. Here's something that might surprise you: Text2SQL isn't as new as you might think. People have been trying to automate the conversion of natural language to SQL for years, long before large language models became mainstream. Earlier attempts used rules-based systems, semantic parsing, and other techniques. They worked to varying degrees, but none achieved reliable accuracy across different types of questions and database structures. What changed everything was the emergence of large language models. These AI systems, trained on massive amounts of code and natural language, turned out to be remarkably good at understanding both human questions and SQL syntax. They could handle complex queries, understand context, and even adapt to different database schemas.
Text2SQL platforms are powerful for specific use cases. If your main bottleneck is getting data out of databases, and you have users who know what questions to ask, these tools can be incredibly valuable. Data analysts can work faster. Business users can get answers without waiting for technical teams. Everyone can explore data more freely. But Text2SQL has clear limitations. You get data tables in response, not visualizations. You still need to know what questions to ask. And you're only querying existing data structures—there's no analytical layer on top. This is where the second wave comes in.
Wave 2 - Text2Code: No-Code Data Analysis
The second wave of GenBI tools took things further. Instead of just returning data tables, these platforms allowed users to get visualizations and analytical insights without the need of using programming languages. This wave became possible because large language models got good at something unexpected: writing code.
Here's how this wave works. When you ask for information, the system doesn't just query your database. It writes actual code—usually Python—to analyze the data and create charts. You might type "Show me sales trends by category over the last year" and get back a line chart, automatically generated, with trends already visualized. This is a bigger leap than it might seem. Writing code to create meaningful visualizations requires understanding data analysis principles, choosing appropriate chart types, handling data transformations, and generating clean visual output. The fact that AI models can do this reliably opened up new possibilities for business users.
This wave democratized data visualization and analysis in ways that weren't possible before. Marketing teams could generate customer segmentation charts on the fly. Sales managers could visualize pipeline trends without opening a spreadsheet. Finance teams could create budget comparison charts by just describing what they wanted to see. But there's still a gap. These platforms excel at answering specific questions and creating individual visualizations. What they don't do well is create cohesive, comprehensive analytical views. You get charts one at a time, in response to questions. You don't get a complete picture of your business metrics in one place. That's the problem the third wave addresses.
Wave 3 - Text2Dashboard: No-Code BI
The third and most recent wave of GenBI is about generating complete dashboards, not just individual queries or charts. This represents a fundamental shift in approach.
With Text2Dashboard platforms, you're not necessarily asking questions at all. Instead, you provide data, and the system automatically builds a full analytical dashboard with multiple visualizations, metrics, filters, and insights working together. Or you can give a high-level directive like "Create a sales performance dashboard" and get a complete analytical environment.
Think about what this means. Earlier GenBI waves required you to know what to ask. Text2SQL needs specific data questions. Text2Chart needs visualization requests. But what if you don't know exactly what questions to ask? What if you need a comprehensive view of a business area but aren't sure which metrics matter most?
For business users, this is transformative. Instead of spending weeks building dashboards manually—deciding on metrics, creating charts, arranging layouts, setting up filters—you can generate a working dashboard in minutes. Need to analyze customer behavior? Generate a customer analytics dashboard. Want to track project performance? Create a project metrics dashboard. It's analytics at a completely different speed.
The Editability Problem: Why Generation Alone Isn't Enough
Here's something that vendors often gloss over when talking about GenBI: generation is only half the battle. Getting an accurate, well-designed dashboard is important, but it's not enough. Real business users need to customize, adapt, change, and control their analytics. This is the editability problem, and it's where many GenBI platforms fall short.
Let's think about why this matters. Suppose a GenBI platform generates a great sales dashboard for you. It's 80% of what you need. But that last 20% makes all the difference. Maybe you need to adjust a filter to show different time periods. Perhaps you want to change a bar chart to a line chart for better trend visibility. Or you need to modify a KPI calculation to match your specific business definition. Or update labels and descriptions to match your company's terminology.
With many GenBI platforms, making these changes is difficult or impossible. The system generated the dashboard, but you can't easily edit it. You have to regenerate it with different instructions and hope the changes work. Or worse, you have to export the results and rebuild things manually in another tool. This creates a frustrating loop where the AI helps you start but can't help you finish.
The editability problem runs deeper than convenience. It's about control. Business users need to feel confident that their analytics match their specific needs. They need to tweak things as requirements evolve. They need to make quick adjustments without going back to the AI generation step every time.
Advanced GenBI platforms solve this problem by combining AI generation with traditional editing capabilities. You can generate a dashboard automatically but then edit every element directly: change chart types, modify filters, adjust KPIs, update labels and descriptions, reorganize layouts, and more. The AI gives you a head start, but you maintain full control over the final product.
Solving the Editability Problem: Text2Dashboard Plus Control
Let's make this concrete with an example using Annie, a Text2Dashboard GenBI platform that demonstrates how modern GenBI actually works in practice. This walkthrough shows both the generation capabilities and the editability features that solve the problems we've discussed.
The process begins with connecting your data. Unlike Text2SQL platforms where you're querying databases directly, dashboard-focused platforms let you both upload csv files or connect to data sources.
Creating the Dashboard: here's where the magic happens. You can simply describe what you want: "Create a sales performance dashboard showing revenue trends, top products, and regional breakdown." Annie's AI interprets this request, analyzes your data structure, and generates a complete dashboard.
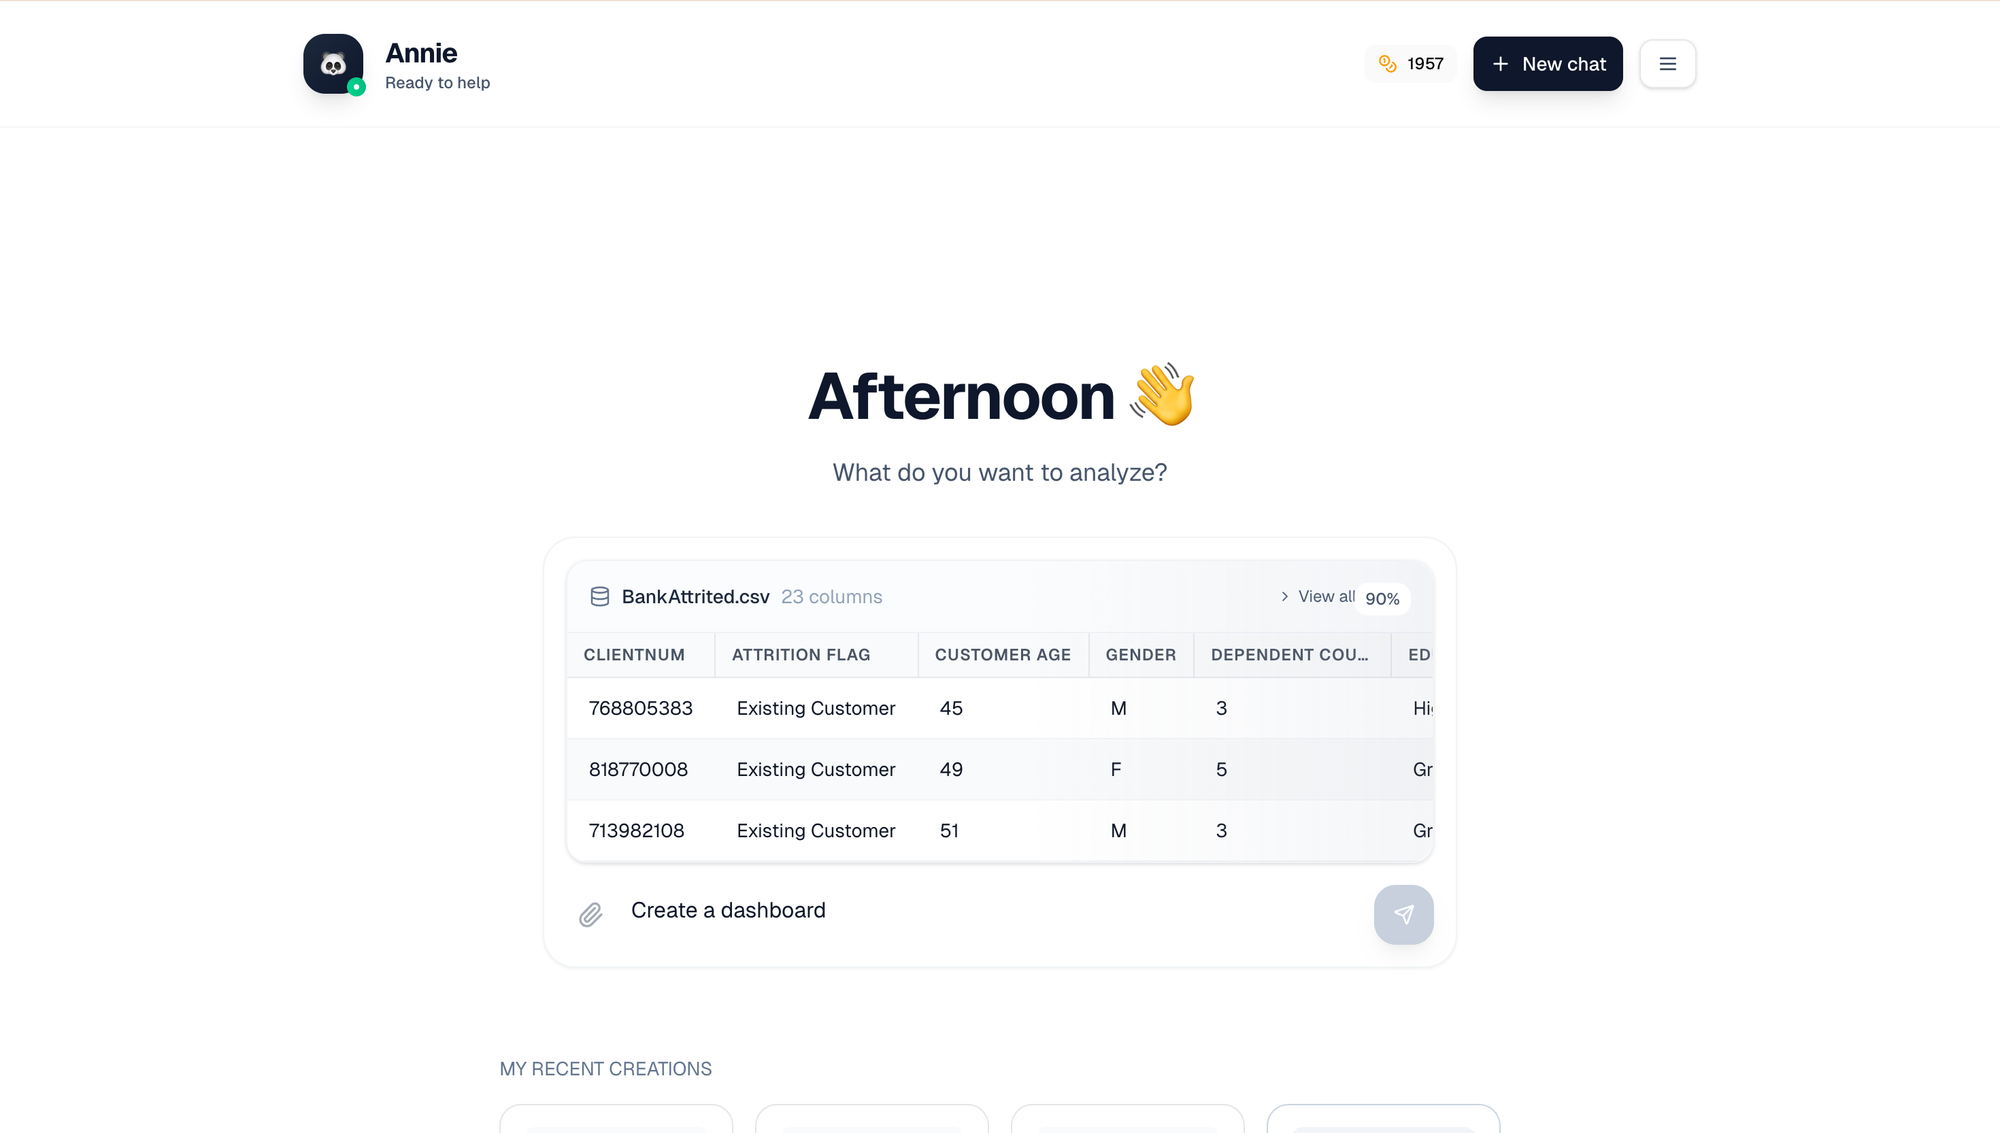
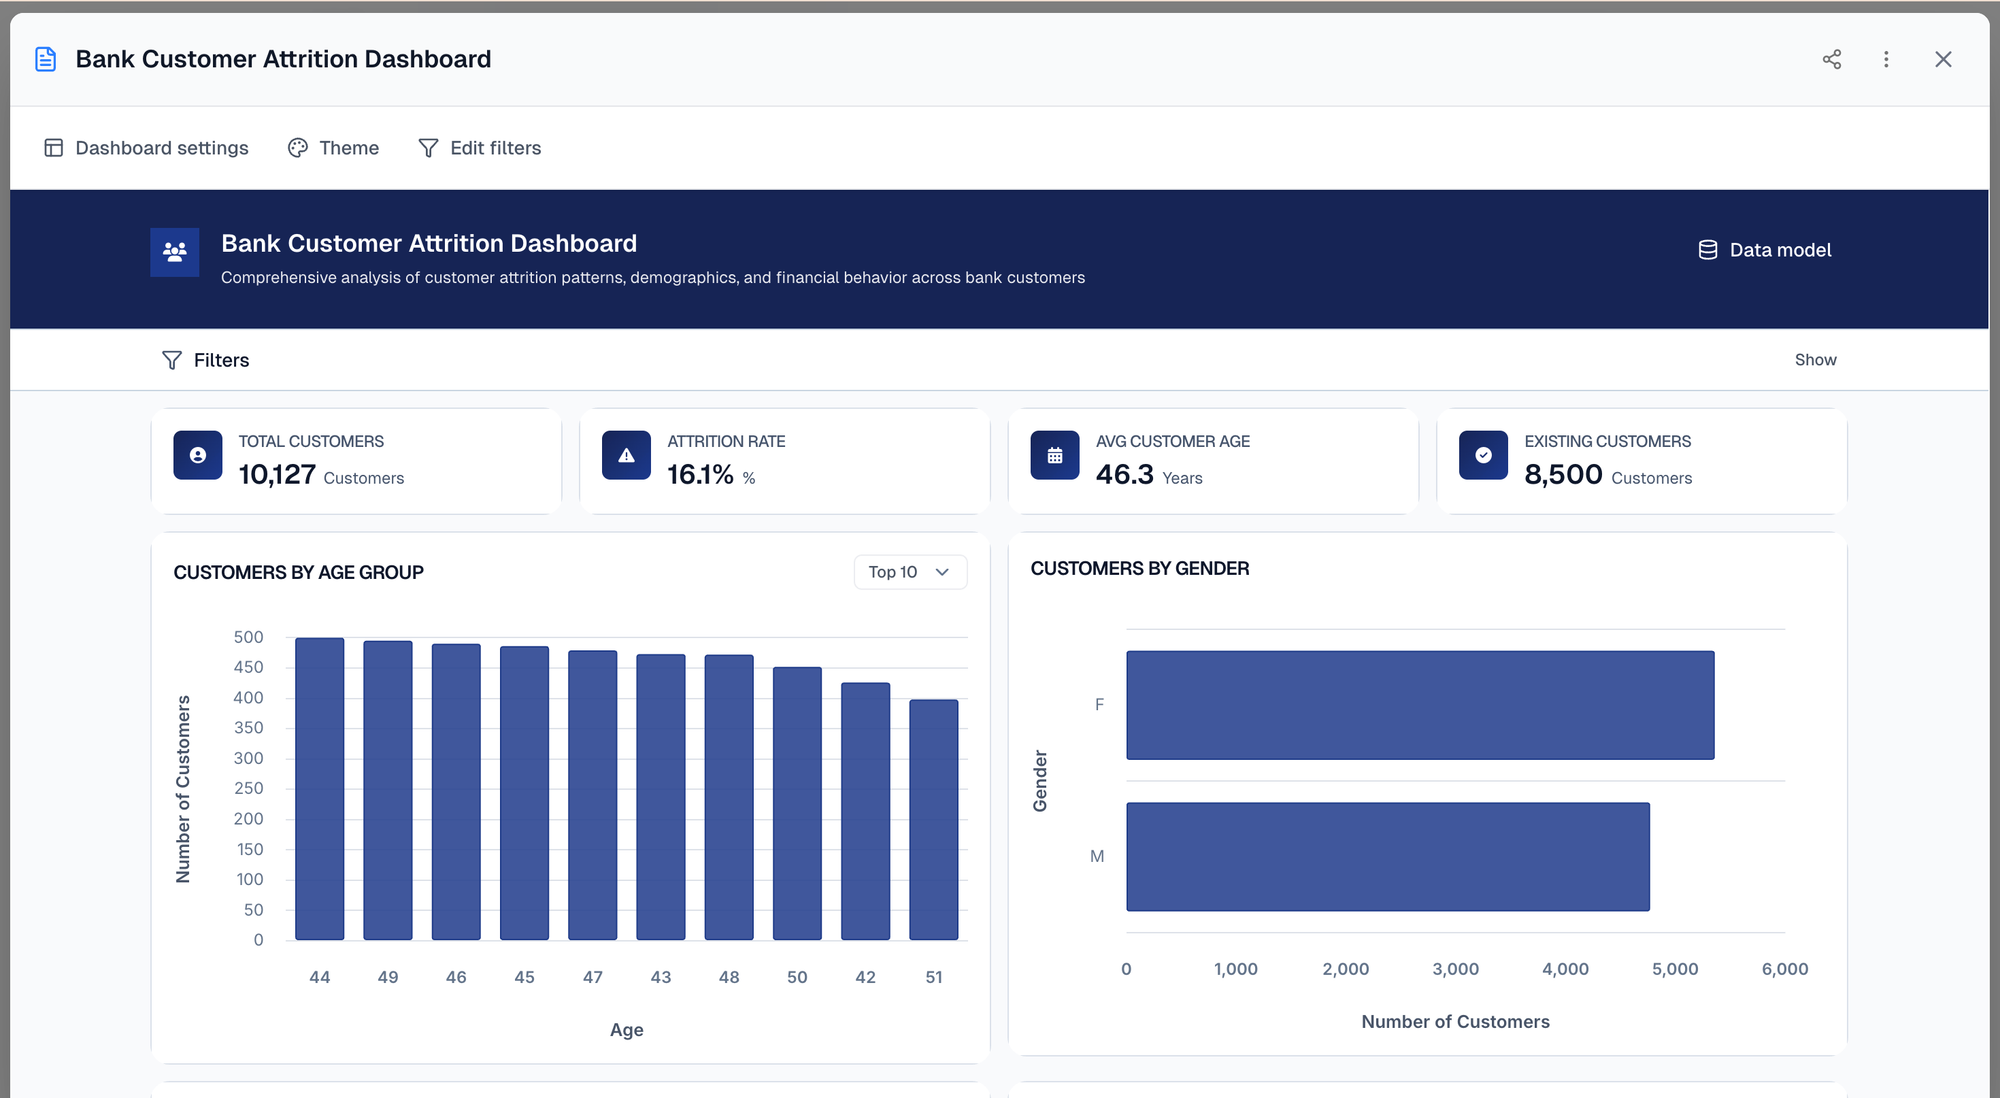
Screenshots of a dashboard request to Annie and the output generated
What gets created isn't just a collection of random charts. You get a thoughtfully organized dashboard with multiple visualizations that work together: trend lines showing performance over time, bar charts comparing categories, KPIs highlighting key metrics, filters for interactive exploration, and descriptive labels explaining what you're seeing. The generation happens in minutes, not hours or days. This speed is what makes GenBI platforms valuable. You can iterate quickly, trying different analytical approaches without investing massive time upfront.
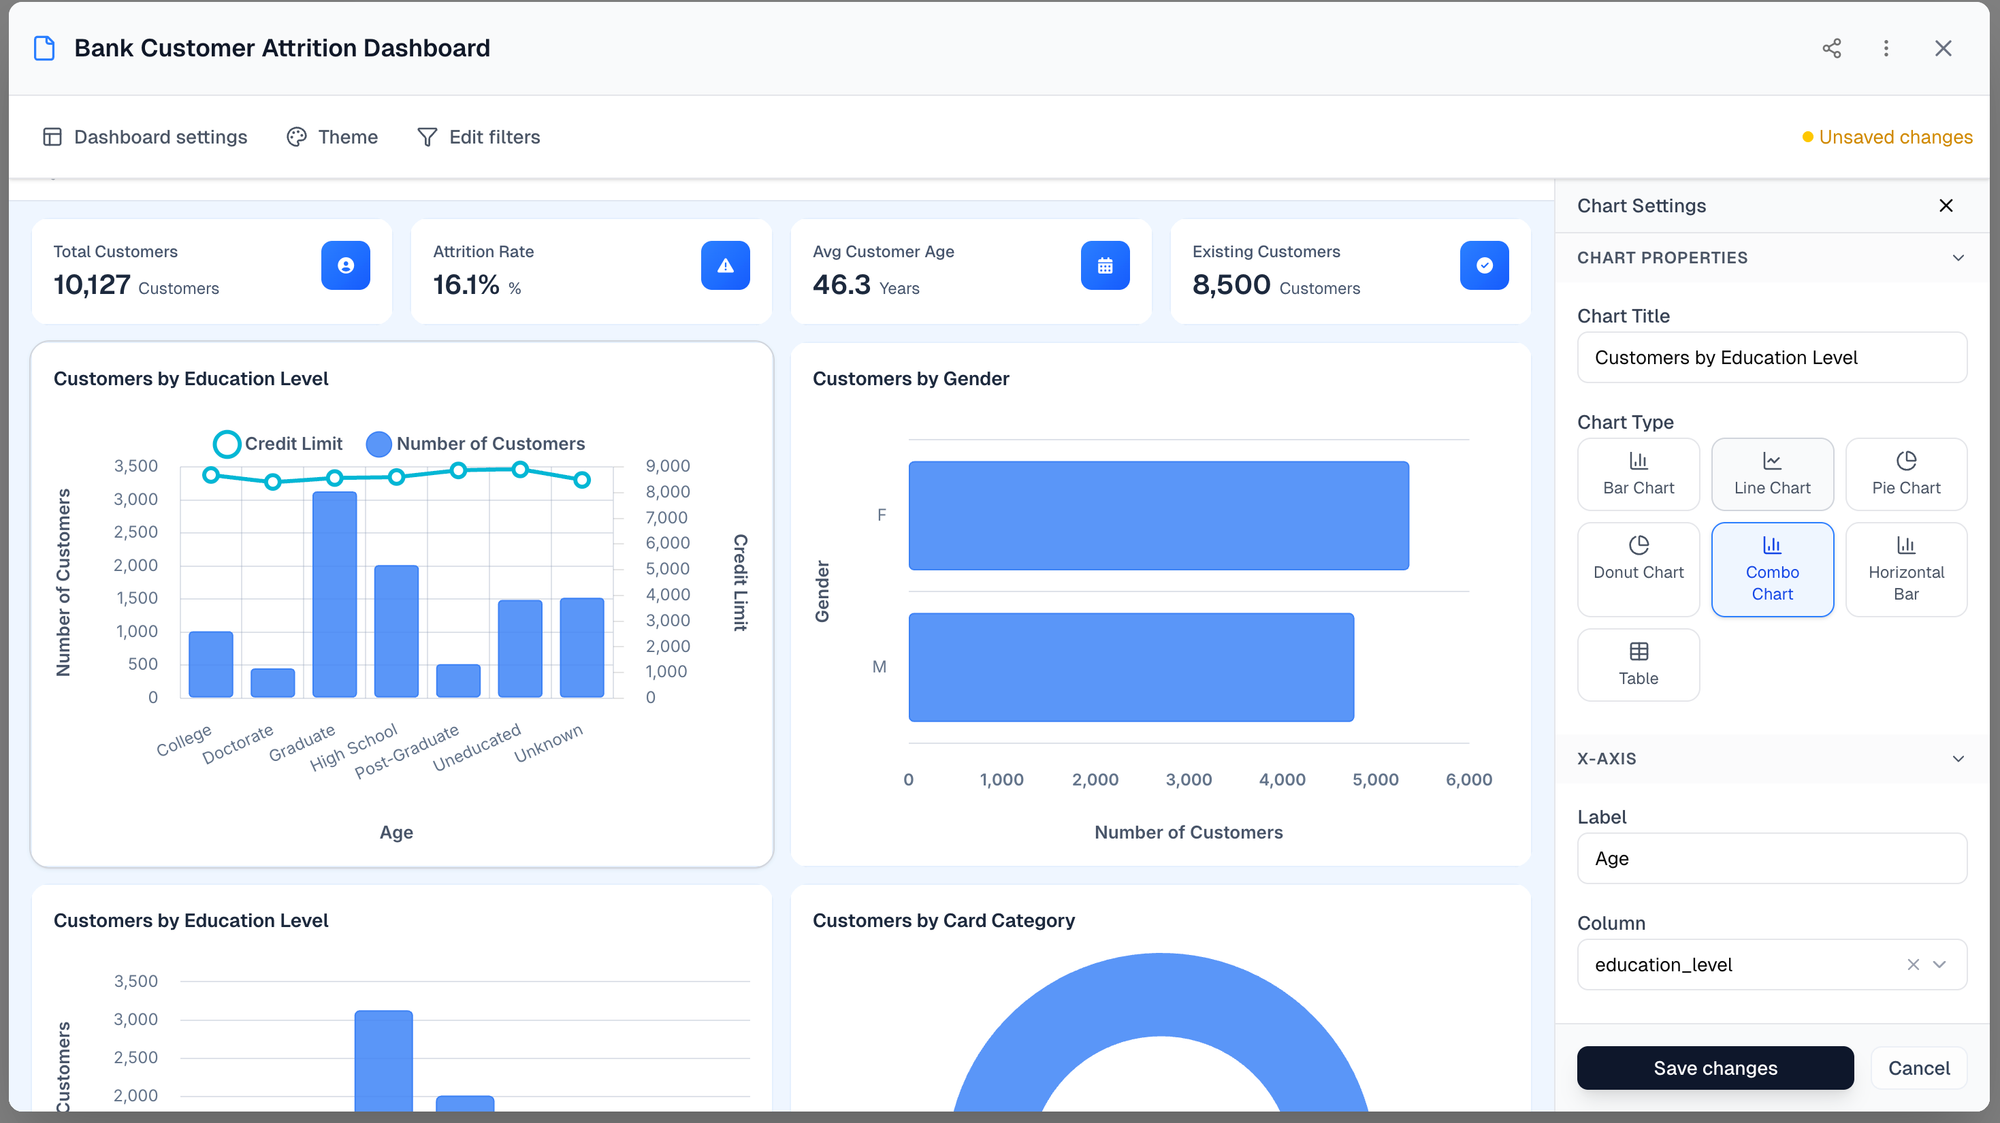
Edit the Dashboard: Filters, Metrics, Charts
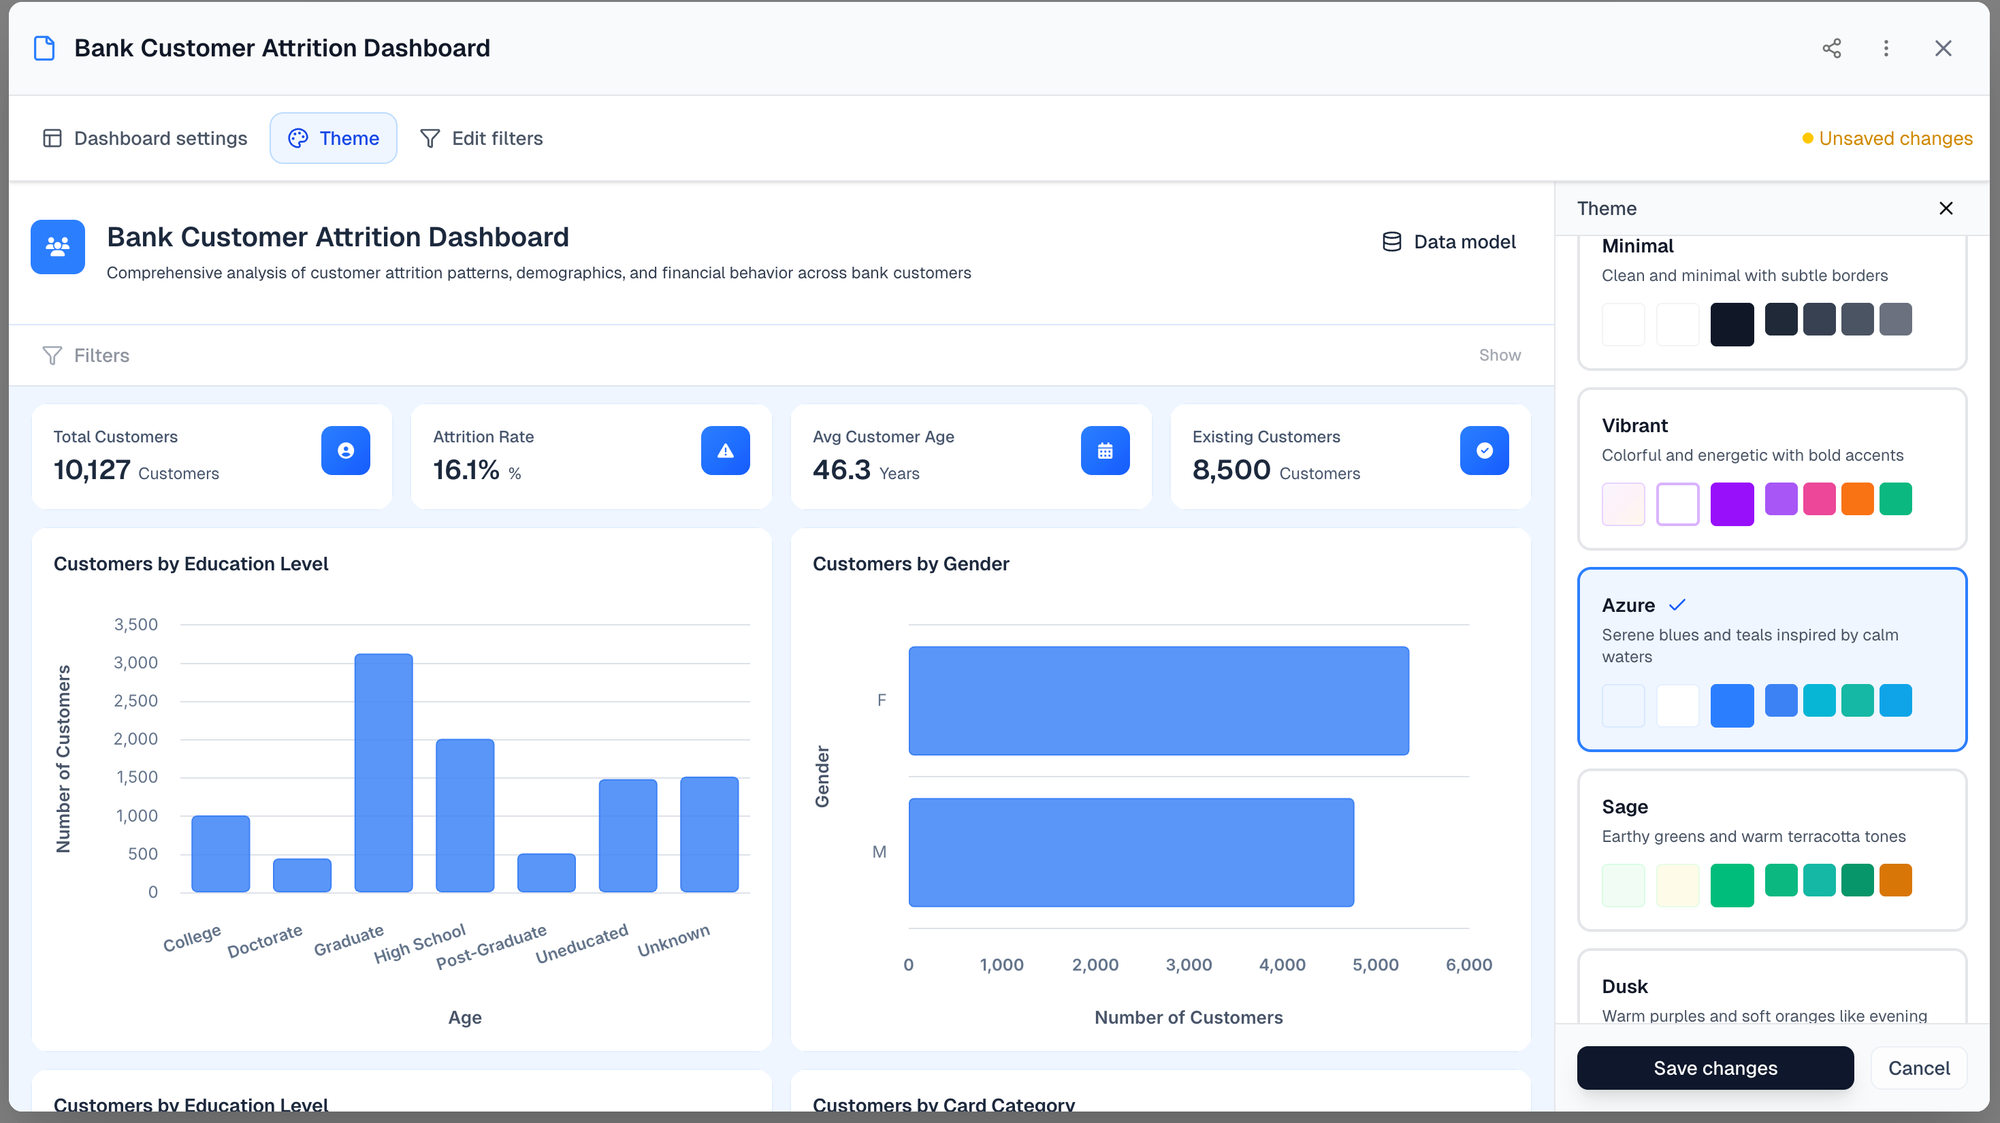
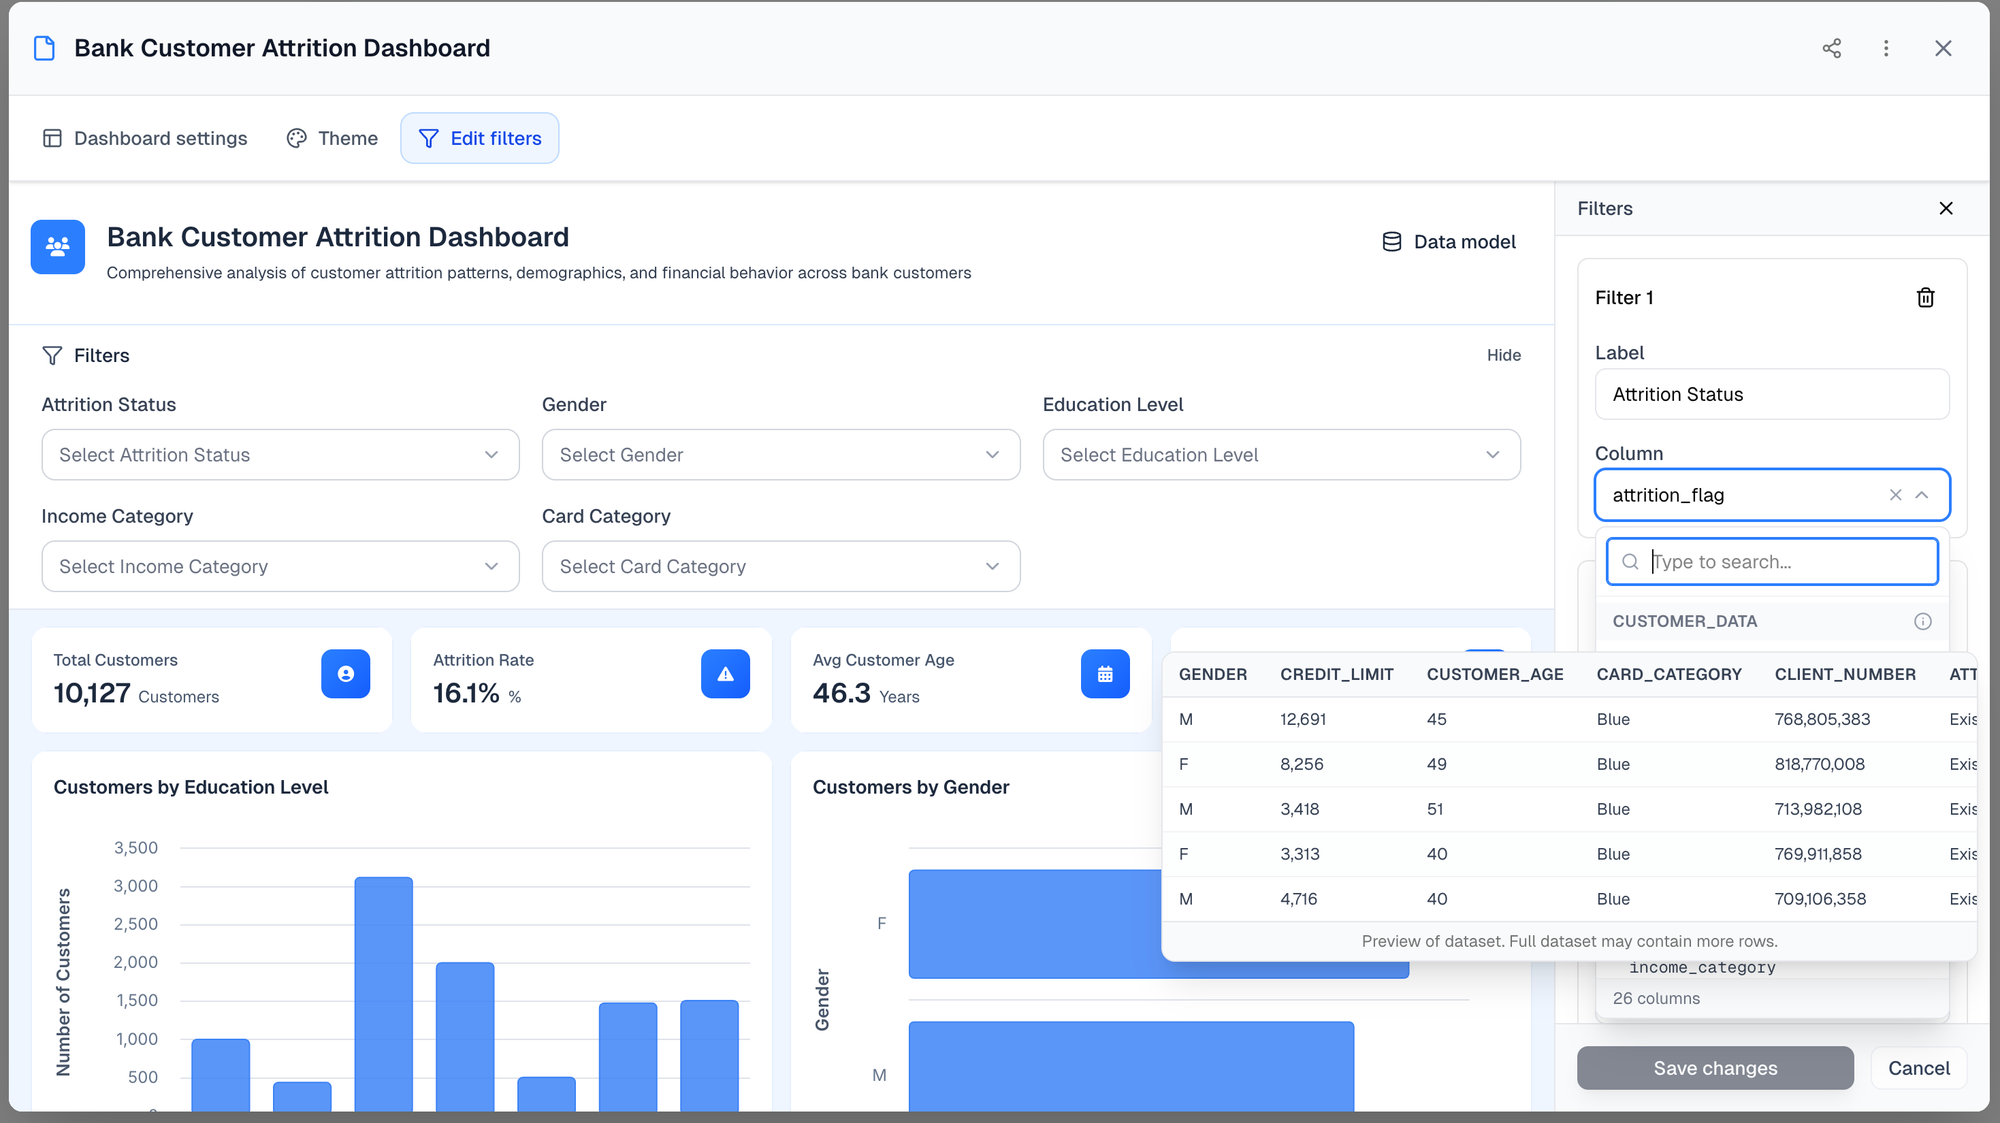
In these screenshots, the user is editing theme and columns charts from the AI-generated dashboard
Now comes the editability part. The AI gave you a strong starting point, but you have complete control to refine every element:
- Charts: Change visualization types with a click. That bar chart might work better as a pie chart. That table could be clearer as a line graph. You can also modify what data each chart displays, adjust colors and styling, and change axis labels.
- Filters: Interactive filters make dashboards useful for different scenarios. The generated dashboard comes with default filters, but you can edit these to match your needs. Add filters for date ranges, product categories, regions, or customer segments. Configure them so different users can slice the data in ways that matter to them.
- KPIs: Key Performance Indicators are critical for at-a-glance understanding. Annie generates relevant KPIs based on your data, but business definitions vary. You can edit KPI calculations to match your company's specific formulas, change thresholds that trigger visual alerts, modify number formatting, and update the metrics entirely if needed.
- Themes, Labels and Descriptions: The AI picks a layout and generates labels based on data column names and general assumptions, but your business uses specific terminology. You can edit all text elements directly—chart titles, axis labels, KPI names, and descriptive text—to make the dashboard feel native to your organization.
This ensures your dashboard reflects your actual business logic and language, not generic calculations and terminology. It's these details that make the difference between a dashboard people use and one they ignore.
Choosing Your GenBI Platform: The Decision Framework
Given this landscape of different GenBI waves and capabilities, how do you choose the right platform? The answer depends entirely on your specific needs, and the wave framework gives you a clear way to think through your options.
1) Start with Your Core Problem
What problem are you actually trying to solve? Be specific. Different problems call for different GenBI approaches.
- If your main challenge is data access—getting information out of databases without technical skills—Text2SQL platforms are your answer. These work best when you have users who know what questions to ask but lack SQL skills.
- If your problem is visualization speed—you need charts and analyses quickly without manual work—Text2Chart and Text2Code platforms fit better. These excel when you're doing exploratory analysis or need to visualize data in meetings on the fly.
- If your challenge is comprehensive analytics—you need full dashboards showing complete views of business areas—Text2Dashboard platforms are what you want. These make sense when you're setting up new analytical areas or need to give teams complete monitoring capabilities.
2) Consider Your Users
Who will use this tool? Their skills and needs should guide your choice. Text2SQL platforms work well for data-literate users who understand databases and can formulate good analytical questions. Text2Chart platforms serve a broader audience—business users who understand their domain but lack technical skills. Text2Dashboard platforms have the widest accessibility. Even users with limited analytical experience can benefit from automatically generated comprehensive views.
3) Evaluate Editability
As we discussed, generation without editability creates frustration. When evaluating any GenBI platform, test the editing capabilities carefully. Can you modify generated outputs directly? Can you adjust calculations, change visualizations, update filters, and refine details? Or are you locked into whatever the AI generates, forced to regenerate entirely for each change? Platforms that combine generation with full editing capabilities will serve you better long-term. The initial AI output is rarely perfect, and business needs evolve. You need tools that work with you throughout the entire analytical lifecycle, not just at the beginning.
4) The Best GenBI Solution Depends on Your Business Needs
Choosing a GenBI platform isn't about finding the "best" tool in absolute terms. It's about matching capabilities to needs. A Text2SQL platform might be perfect for a data team but wrong for executives who need dashboards. A Text2Dashboard platform might be ideal for business users but overkill for analysts who just need quick queries.
Use the three-wave framework to categorize your options. Understand which category addresses your core problems. Evaluate editability to ensure you can move from generation to refinement smoothly. And always test with your actual data and users to see what works in practice, not just in demos.
The GenBI landscape is complex because it encompasses fundamentally different approaches to combining AI with analytics. That complexity becomes clarity when you understand the evolution, recognize the waves, and match capabilities to your specific needs. Armed with this understanding, you can cut through the marketing hype and choose tools that actually solve your problems.
The evolution from Text2SQL through Text2Chart to Text2Dashboard represents genuine progress in making analytics more accessible, faster, and more intelligent. Each wave opened new possibilities while creating new challenges. The platforms that succeed long-term will be those that acknowledge both the power of generation and the necessity of control, giving users the best of both worlds. And this is why we built Annie.