Cognitive Biases in Business Intelligence

Interpreting data from dashboards and charts always comes with a risk: congitive biases affecting our focus and the decisions taken. In traditional BI pipelines, these biases risk to be amplified, as an individual analyst decides what to show and what not to show, constraining the thinking and data exploration process of other stakeholders. GenerativeBI, while not bias-free, reduces the impact of biases by allowing more users to explore and visualize data.
What we'll cover
- Which cognitive biases distort data interpretation?
- Why do BI dashboards risk to amplify biases?
- How can GenBI reduce subjectivity in data analysis?
- Where does bias mitigation happen in practice?
- What do organizations need to adopt GenBI solutions?
Which cognitive biases distort data interpretation?
Humans rely on mental shortcuts more than they realize. These shortcuts, called heuristics, help the brain process information quickly when time and mental energy are limited. But when interpreting data, these same shortcuts can lead to systematic errors in judgment. Even when dashboards display the numbers clearly, humans still introduce bias. The human brain craves the easiest path to understanding, helping us overcome the mental discomfort of confusion. When logic is not immediately clear, we turn to shortcuts to derive meaning—even if that meaning is not accurate.
Analysts creating dashboards face the same problem. When they lack clear questions to guide their work, or worse, when they start with the wrong questions, they risk selecting visualizations that confirm their existing beliefs rather than revealing true patterns. This creates a double layer of bias: first in what gets shown, then in how it gets interpreted.
| Bias | How It Shows Up | Impact on Decisions |
|---|---|---|
| Anchoring | Teams rely on last year's numbers or last quarter's forecast | Plans become outdated and inflexible |
| Confirmation Bias | Users search for data supporting their beliefs | Important contradictory signals are ignored |
| Recency Bias | Overreacting to the latest performance spike or dip | Decisions become reactive instead of strategic |
| Groupthink | Teams avoid challenging senior opinions | Weak narratives go unchallenged |
Four critical biases consistently distort data analysis and business decisions.
- Anchoring happens when people rely heavily on the first piece of information they encounter. Teams latch onto last year's revenue target or last quarter's forecast. All new data gets filtered through this initial reference point, making it difficult to adjust plans when conditions change.
- Confirmation Bias means people search for and interpret information in ways that confirm their existing beliefs. Analysts unconsciously select metrics that validate their hypotheses. Leaders favor dashboards that prove their strategy is working. The mind seeks support, not truth.
- Recency Bias occurs when recent events receive disproportionate weight while older information gets neglected. A sudden spike in customer churn feels like a crisis. A good sales month looks like a lasting trend. Short-term fluctuations overshadow long-term patterns.
- Groupthink emerges when the desire for harmony leads to dysfunctional decision-making. Team members suppress dissent rather than critically evaluating options. Nobody wants to challenge senior leaders. Even when data contradicts the prevailing view, silence wins.
Why do BI dashboards risk amplifying biases?
BI dashboards were designed to make decisions objective. But when cognitive biases go unexamined, dashboards can unintentionally do the opposite.
- The problem starts with who builds the dashboard. A single analyst or small team decides which metrics matter, which dimensions to include, and how data should be visualized. These aren't neutral choices. Every decision about what to show—and what to hide—carries the creator's assumptions and mental shortcuts. When that analyst anchors on last quarter's priorities, the entire dashboard reflects that anchor. When they suffer from confirmation bias, they design views that validate existing strategies. When recency bias dominates their thinking, short-term metrics get prominence over long-term trends. The creator's biases become embedded in the infrastructure.
- This creates a bottleneck. Instead of reducing bias through broader perspective, traditional BI amplifies it by constraining everyone else's thinking. Users can only explore what the dashboard allows them to explore. They can only ask questions the original designer anticipated. The filter options, the metric definitions, the time ranges—all predetermined by someone else's worldview.
- Once deployed, dashboards take on a life of their own. Teams stop questioning whether they're looking at the right things. The dashboard becomes the official version of reality, even when business conditions shift. Static designs encourage anchoring at the organizational level, locking everyone into a fixed interpretation.
The real issue isn't access to data—most organizations have plenty. The problem is concentration of interpretive power. When one person or small team controls what gets visualized and how, their cognitive shortcuts shape how everyone else thinks about the business. Bias doesn't just exist—it scales.
How can Generative BI reduce subjectivity in data analysis?
Traditional BI created a bottleneck: one analyst decides what matters, and everyone else inherits their biases. Generative BI platforms break this bottleneck by letting users generate their own dashboards and charts on demand.
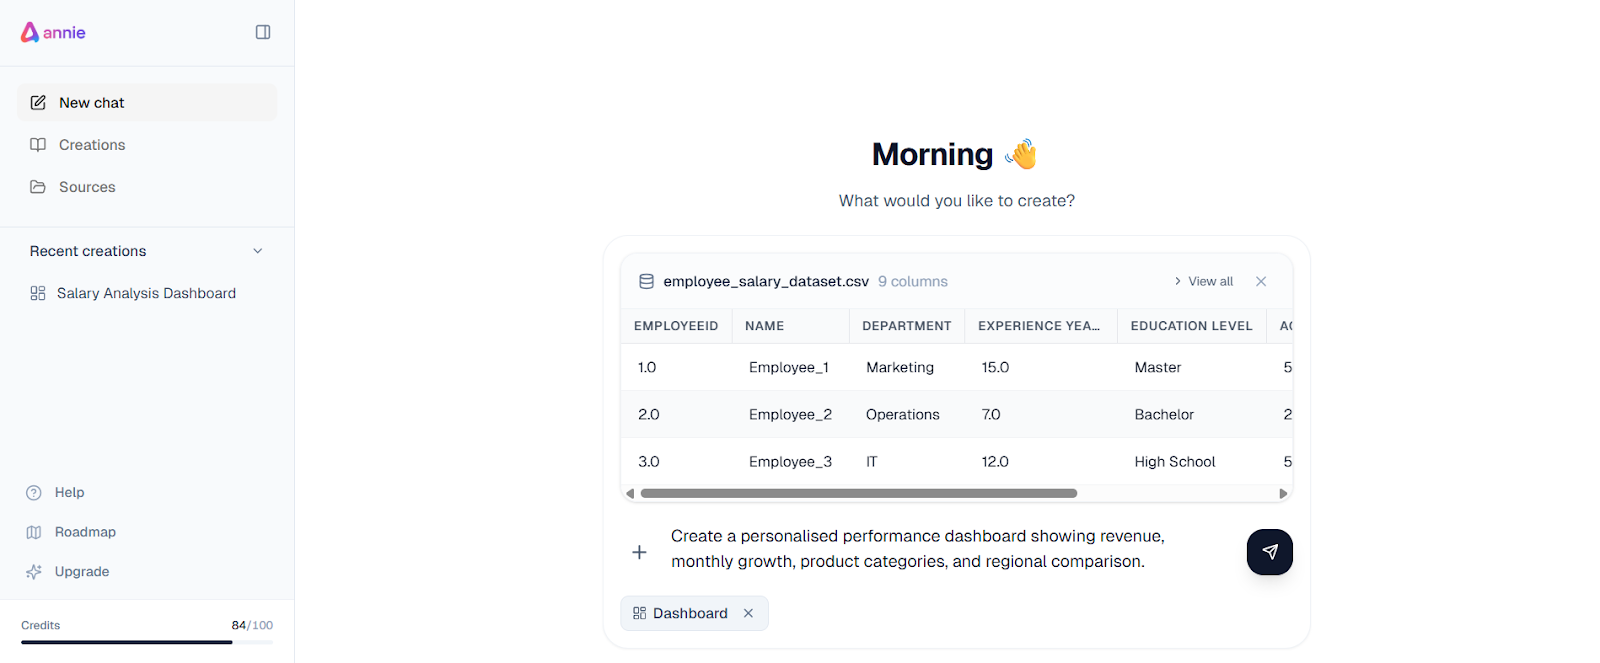
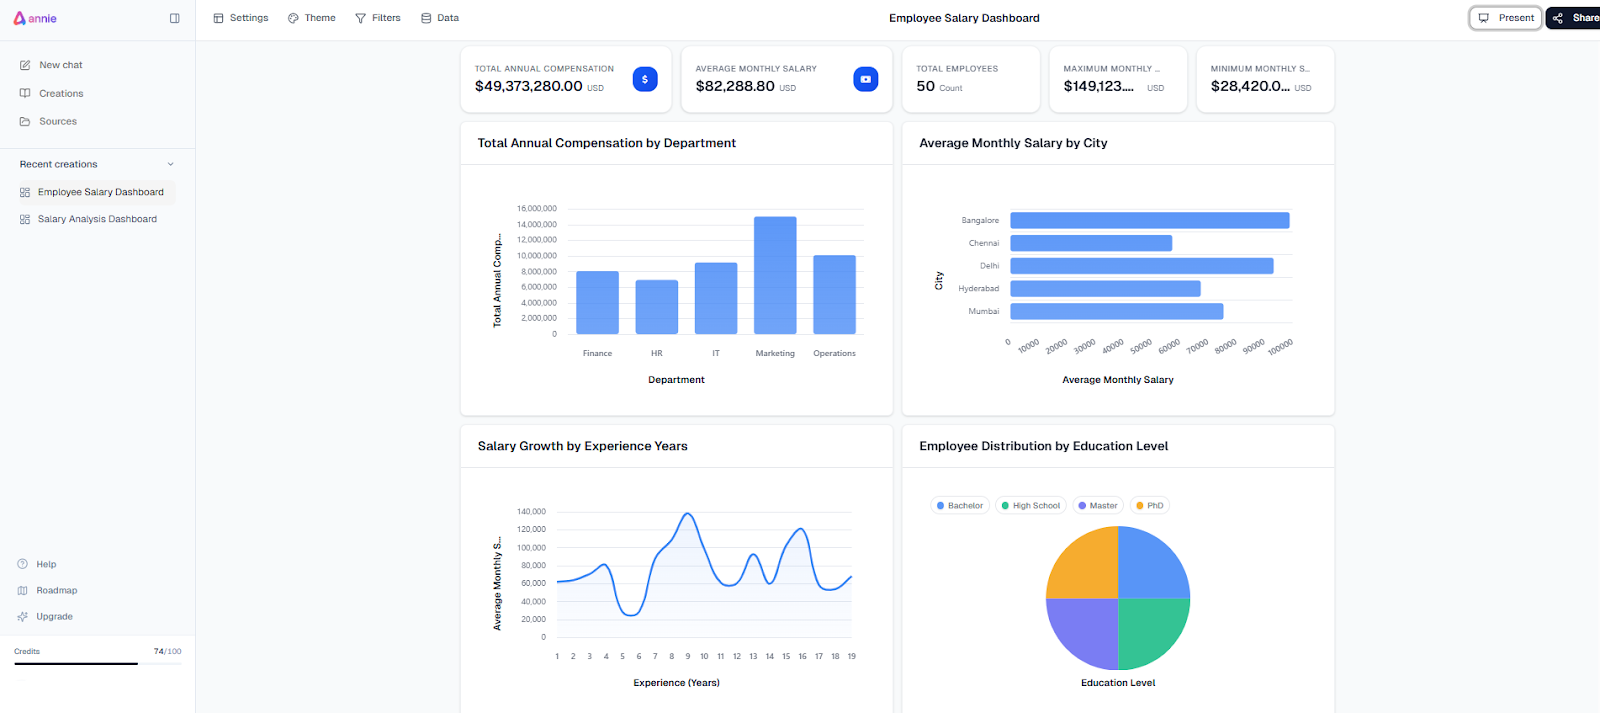
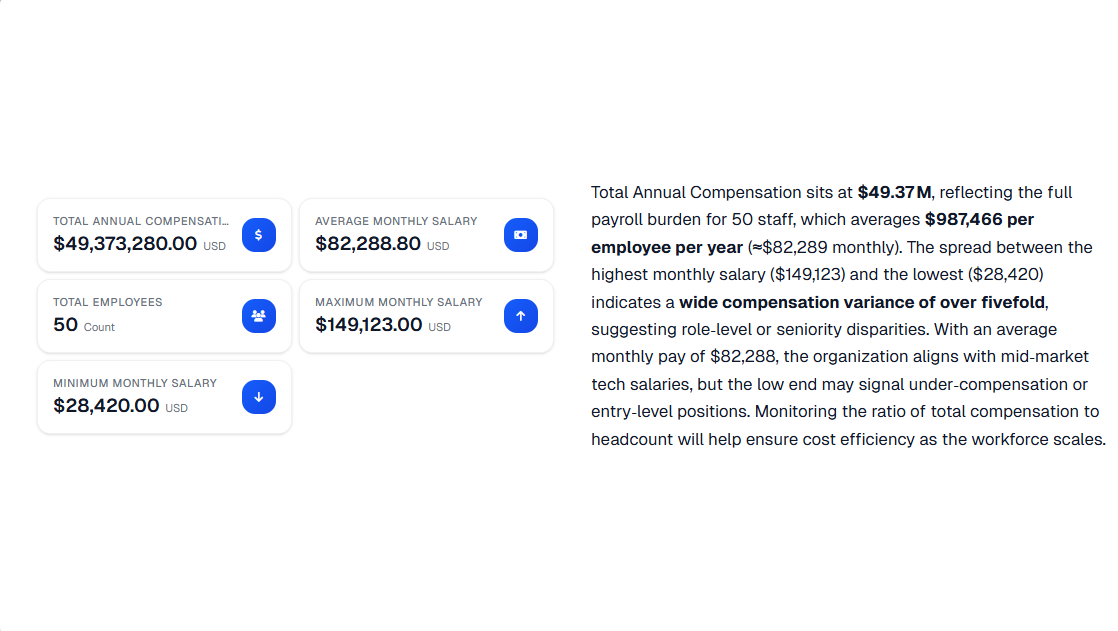
Example of how a GenBI platform creates real-time editable dashboards
The shift is simple but profound. Instead of waiting for an analyst to build a dashboard, a marketing manager types: "Show me customer acquisition cost by channel for the past six months." The system generates the visualization instantly. A sales director asks: "Why did our conversion rate drop in the Northeast?" The platform analyzes the data and presents possible explanations.
No pre-built dashboard required. No analyst as gatekeeper. No single person's assumptions embedded in the infrastructure. By enabling self-service BI and direct data exploration, Generative BI platforms reduce bias amplification in three ways:
- Distributing interpretive power: when more people explore data directly, individual biases don't scale across the organization. Each user brings their own perspective—the marketing manager asks different questions than the sales director or operations lead. This diversity of viewpoints becomes a natural check against any single person's mental shortcuts. Confirmation bias still exists, but it's the user's own bias, not someone else's imposed through a fixed dashboard.
- Surfacing what humans overlook. LLMs don't have favorite metrics or comfortable patterns. They examine every variable and correlation with equal attention, exposing relationships that contradict prevailing narratives. Revenue climbing while margins shrink? Engagement strong but conversions flat? Humans rationalize these contradictions away. Generative BI platforms highlight them immediately. They also generate multiple explanations automatically—ask why sales declined and the system might suggest seasonal patterns, competitive pressure, or pricing changes. This challenges anchoring by presenting alternatives the user hadn't considered.
- Removing social pressure. A junior analyst may hesitate to contradict the CFO's interpretation. An LLM doesn't. It presents what the data shows regardless of hierarchy, creating space for evidence to challenge assumptions without requiring courage. This won't eliminate organizational politics, but it prevents uncomfortable truths from being filtered out before they reach decision-makers.
Where does bias mitigation happen in practice?
The shift from bias amplification to bias reduction isn't abstract. It happens in concrete business decisions where generative BI platforms help teams see patterns they would otherwise miss or misinterpret. The table below shows how these biases manifest across business functions and how generative BI helps correct them:
| Function | Typical Bias | How It Appears | How Generative BI Corrects It |
|---|---|---|---|
| Sales | Recency bias | Over-focusing on last month's performance | Analyzes complete historical cycles and flags early warnings |
| Finance | Anchoring | Starting budgets from last year's numbers | Generates scenario models and challenges assumptions |
| HR | Confirmation bias | Favoring candidates who "feel right" | Surfaces skills-based patterns over impressions |
| Marketing | Attribution bias | Over-crediting favorite channels | Evaluates all touchpoints objectively |
| Operations | Habit bias | Repeating outdated rules and practices | Detects inefficiencies and updates forecasts |
Sales Forecasting
Traditional sales forecasts mix optimism with last quarter's numbers. Teams anchor on recent performance—a strong month becomes the baseline for next quarter's target. A weak period triggers panic and aggressive discounting. The forecast reflects emotion more than probability.
Generative BI platforms change this dynamic in specific ways:
- They compare performance against complete historical cycles, not just recent quarters, showing whether current trends represent genuine change or normal variance
- They flag early warning signals like declining win rates or lengthening sales cycles before they become obvious
- They surface contradictions between activity metrics (meetings, proposals) and outcome metrics (closed deals, deal size)
Sales forecasts become probability-based assessments grounded in patterns, not anchored guesses shaped by recent memory.
Financial Planning
Annual budgets typically start with last year's numbers. Finance teams adjust spending categories up or down based on this anchor, rarely questioning whether the underlying assumptions still hold. Anchoring bias turns planning into repetition.
When finance teams use generative BI to explore spending patterns, the system doesn't inherit last year's assumptions:
- It detects cost categories drifting from historical norms, highlighting where actual spending diverges from plans
- It challenges embedded assumptions by showing what happens under different growth scenarios or market conditions
- It generates alternative baseline models instead of defaulting to incremental adjustments
Financial planning becomes adaptive, responding to current patterns rather than anchoring on past decisions.
HR and Performance Management
Performance reviews suffer badly from recency bias. Managers remember the last quarter vividly while earlier performance fades. A recent mistake overshadows six months of solid work. Hiring decisions rely on "culture fit"—often code for confirmation bias favoring candidates who remind us of existing team members.
Generative BI platforms provide different inputs for these decisions:
- They surface long-term performance patterns, giving recent events their proper statistical weight rather than emotional weight
- They contextualize outliers, showing whether exceptional performance represents a genuine shift or normal variance
- They highlight skills-based patterns that replace subjective impressions with measurable trends
Evaluation becomes more consistent, reducing both recency bias in performance reviews and confirmation bias in hiring.
Marketing Attribution
Marketing teams defend their favorite channels passionately. The CMO's preferred tactics receive generous credit. Underperforming channels get rationalized rather than questioned. Attribution becomes political rather than analytical.
Generative BI platforms cut through this by:
- Evaluating all touchpoints without inherited preferences, showing actual contribution to conversion regardless of channel reputation
- Revealing diminishing returns that humans rationalize away when defending preferred channels
- Exposing contradictions between engagement metrics (clicks, views) and business outcomes (conversions, retention)
Marketing attribution shifts from opinion-based to evidence-based, replacing politically motivated interpretation with neutral analysis.
Operational Planning
Operations teams rely on established rules and past practices. Staffing models repeat last year's approach. Inventory decisions anchor on historical safety stock levels. Demand forecasts overreact to last week's spike while missing gradual structural changes.
When operations teams ask generative BI platforms to analyze demand or capacity:
- The system forecasts without inheriting human habits, analyzing patterns fresh rather than defaulting to "how we've always done it"
- It highlights constraints that experienced managers work around rather than fix, exposing inefficiencies that habit has made invisible
- It distinguishes noise from signal, preventing overreaction to isolated events while catching meaningful shifts
Operational decisions become more stable, responding to actual patterns rather than recent memory or inherited assumptions.
You're absolutely right. Let me rewrite it to be much simpler and easier to follow:
What do organizations need to adopt Generative BI?
Moving to bias-resistant analysis doesn't require perfect data or a complete analytics overhaul. Most organizations already have what they need, as they are three simple requirements:
- Data that is consistent enough: Generative BI doesn't need pristine data warehouses. It needs consistency. Column names that mean the same thing. Date formats that don't change randomly. Metric definitions that stay stable. Most organizations already have this level of consistency. They just don't realize it's enough to start.
- Light governance: perfect governance kills momentum. But shared terminology matters. When "revenue" means the same thing to sales, finance, and operations, everyone trusts the dashboards generated. A simple glossary of key terms usually suffices. No bureaucratic approval processes needed.
- A cultural shift: this is the biggest barrier, and it's not technical—it's behavioral. Traditional BI taught people to wait. Request a dashboard. Wait weeks. Make decisions based on what you receive, not what you need. Generative BI requires a different approach: ask your own questions and explore the answers directly. Marketing managers generate their own acquisition analysis. Sales directors investigate conversion patterns without waiting. Operations leads forecast demand interactively. This feels uncomfortable at first. But the discomfort is the point. When users explore data themselves instead of inheriting someone else's dashboard, bias stops scaling across the organization.
Once you have consistent data, basic terminology, and people willing to explore—generative BI scales quickly across the entire organization. No massive implementation. No months of development. No extensive training. Users ask questions. The system generates answers. The bottleneck disappears.
Ready to explore if this fits your organization?
Talk with our founding team about whether your data and culture are ready for this shift.